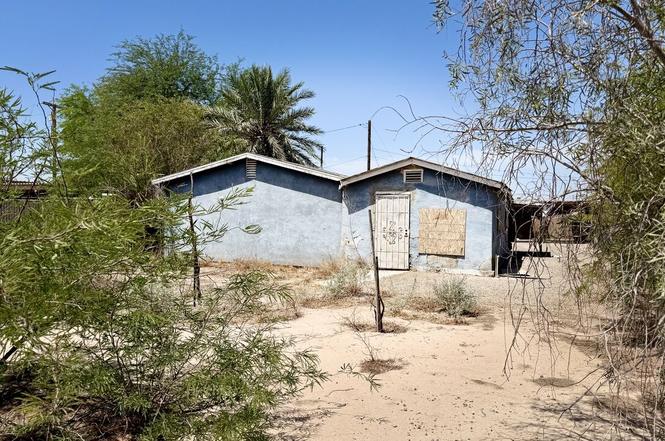
501 S P St
Imperial, CA 92251
$90,000B-
1 bd · 1.0 ba ·
670 sqft ·
Built 1920
· SingleFamily
· Pending
· 217 DOM
Cashflow @ list (25.0% down · 7.5%)
Estimated rent
$1,605/mo
Mortgage (P&I)
−$472
Tax + insurance
−$119
HOA
−$0
Vac / Maint / Mgmt
−$337
Net cashflow
$677/mo
Annual
$8,127/yr
Cap rate
15.32%
Cash-on-cash
32.25%
DSCR
2.43
1% rule
1.78%
Cash to close
$25,200
Investor read
- This is a 1-bed/1.0-bath single-family listed at $90k.
- At list price, monthly cash flow is $677 ($8k/yr) — positive.
- The deal already cash-flows at list — no discount required.
- Meets the 1% rule at list price ($2k rent vs $90k).
- It's been on market 217 days — a 12% lower offer ($79k) is reasonable based on typical stale-listing flexibility.
- Recommended offer: $79k (12.0% below list) — sets the bar for market timing.
- Local home prices are declining (-3.0%/yr); year-one equity from $622 of loan paydown is wiped out by about $3k of value loss. Plan a longer hold.
- Location reads 68/100 on livability (#286 in CA) — a middle-class / working-renter tenant base. Strengths: crime A+, housing A+, employment A-; Watch: amenities F, commute F, cost of living F.
- Imperial Unified (suburban): math 21% / reading 44% proficiency, ranked #281 of 517 in CA (top 54%) — families likely to look elsewhere, expect single-tenant / working-renter base with shorter leases.
- Zoned schools: T. L. Waggoner Elementary (math 20% / reading 42%, grade F, #821 of 1,571 statewide, top 53%, 600 students, 52% FRL); Frank M. Wright Middle (math 20% / reading 45%, grade F, #202 of 498 statewide, top 41%, 1,023 students, 61% FRL); Imperial High (math 17% / reading 60%, grade F, #567 of 1,170 statewide, top 49%, 1,362 students, 53% FRL) — zoned schools average 55% FRL vs 36% district-wide (19 pts higher); higher-poverty schools than district average — tighter screening recommended.
- Watch-outs: built in 1920 — expect roof / HVAC / electrical / plumbing capex.
- Market conditions: 120 active listings in the ZIP; solid renter incomes; 271 units permitted in Imperial County in 2024 (112 in 5+ unit buildings).
- Imperial County population projected at +7% by 2050 — modest demand growth; plan on rents tracking national, not racing it.
- 2 sale attempts; this cycle's ask has dropped $70k (44%) from the opening price — seller is motivated, your offer sets the floor, not the list.
- At projected returns (-3.0% appreciation + 3.0% rent growth), your $25k cash investment doubles in ~4 years — after that, you're playing with house money.
- Climate carrying-cost: extreme-heat days projected 7→22/yr by 2055 (HVAC capex compounding) — expect insurance premiums to compound above CPI over the hold.
- Cap rate 15.3% vs local median 3.9% in Imperial — top-decile yield for the area; either an underpriced asset or a hidden risk that comps aren't pricing in. Stress-test before assuming the spread holds.
Questions for listing agent
- It's been on market 217 days. Have you received any prior offers? Is the seller open to a 12% concession, seller financing, or rate buy-down credit?
- Built in 1920 — when were the roof, HVAC, electrical panel, plumbing, and water heater last replaced?
- Why hasn't it sold? Are there any deal-killer items the seller is aware of (foundation, flood, title, zoning, code violations)?
- Is there a deadline driving the sale (1031 exchange, divorce, estate, relocation)? That informs how much negotiation room exists.
- What's the average days-on-market for RENTAL listings here right now (not sales)? A rising rental-DOM trend means longer vacancies and softer asking-rent achievability than the comps imply.
- What's the recent tenant-quality profile in this submarket — average credit score on applications, eviction rate, late-payment / NSF rate, and stable-employment percentage? A property-management company in the area should have these aggregated.
- How much new for-sale + rental construction is in the pipeline within 1–3 miles? Heavy new supply typically softens prices + rents 12–24 months out; constrained supply supports both.
CashFlowRE · CFR-1Z3SGB5F8MM8ET
· Data 1 week ago
cashflowre.app · 2026-05-29