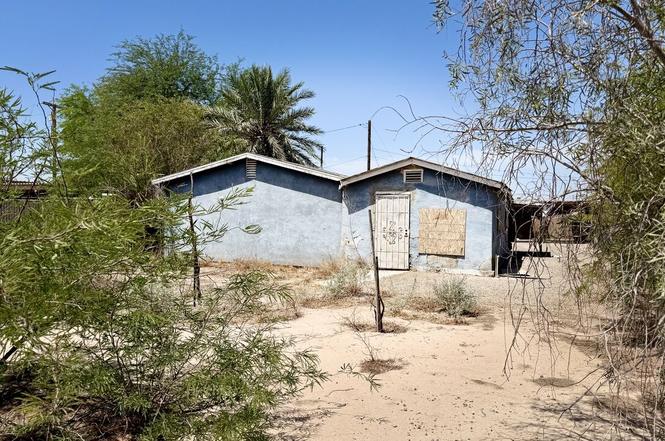
501 S P St · Imperial, CA
Flood risk 1/10 · Minimal
- FEMA flood zone
- X (unshaded)
- Chance of flooding over 30 yrs
- 0.0%
- Est. flood insurance / yr
- $507 – $1,088
Fire risk 3/10 · Minor
- Est. fire insurance / yr
- $659 – $1,223
Heat risk 10/10 · Severe
- Hot days now (above 114°F)
- 7 days/yr
- Hot days in 30 yrs
- 22 days/yr
Wind risk 1/10 · Minimal
- Chance of severe wind over 30 yrs
- —
Air-quality risk 3/10 · Minor
- Unhealthy air days now
- 2 days/yr
- Unhealthy air days in 30 yrs
- 3 days/yr
Risk factors via First Street. Map © Google.
Why this score? — see what drove the B- grade
The composite is a weighted blend of 9 inputs, each scored 0–100. Each bar is that input's sub-score; the figure is the points it added to the 100-point composite (weight × sub-score).
- Cash flow +30.0/30.0
- 1% rule +10.0/10.0
- DSCR +10.0/10.0
- ARV discount +7.5/15.0
- Livability +3.4/5.0
- Schools +3.0/10.0
- Rent growth +2.5/5.0
- Condition / age +2.5/5.0
- Appreciation +0.0/10.0
$90,000
🖨 Deal sheet (PDF) 📄 Offer letter ✓ Due diligence
Listing remarks
General Industrial Zoned Property | Redevelopment Opportunity | Imperial, CA. Now available: A rare opportunity to acquire a General Industrial (I-2) zoned property in the City of Imperial. Situated on a generously sized lot with alley access, this site is ideal for contractors, developers, or investors looking for a value-add industrial project in a growing market. The existing structure is a fixer-upper and requires full rehabilitation, offering a clean slate for industrial redevelopment or adaptive reuse. Existing improvements include multiple rooms, a detached laundry area, a large covered carport/workshop, and partial utility infrastructure such as an electrical panel and water heater.
Key facts
- Alley access
- Fully fenced
- Mature shade trees
Tags
Neighborhood map
What this means for you Summary
Snapshot
- This is a 1-bed/1.0-bath single-family listed at $90k.
Deal economics
- At list price, monthly cash flow is $677 ($8k/yr) — positive.
- The deal already cash-flows at list — no discount required.
- Meets the 1% rule at list price ($2k rent vs $90k).
- Recommended offer: $79k (12.0% below list) — sets the bar for market timing.
- Cap rate 15.3% vs local median 3.9% in Imperial — top-decile yield for the area; either an underpriced asset or a hidden risk that comps aren't pricing in. Stress-test before assuming the spread holds.
Location & tenants
- Location reads 68/100 on livability (#286 in CA) — a middle-class / working-renter tenant base. Strengths: crime A+, housing A+, employment A-; Watch: amenities F, commute F, cost of living F.
- Imperial Unified (suburban): math 21% / reading 44% proficiency, ranked #281 of 517 in CA (top 54%) — families likely to look elsewhere, expect single-tenant / working-renter base with shorter leases.
- Zoned schools: T. L. Waggoner Elementary (math 20% / reading 42%, grade F, #821 of 1,571 statewide, top 53%, 600 students, 52% FRL); Frank M. Wright Middle (math 20% / reading 45%, grade F, #202 of 498 statewide, top 41%, 1,023 students, 61% FRL); Imperial High (math 17% / reading 60%, grade F, #567 of 1,170 statewide, top 49%, 1,362 students, 53% FRL) — zoned schools average 55% FRL vs 36% district-wide (19 pts higher); higher-poverty schools than district average — tighter screening recommended.
- Market conditions: 120 active listings in the ZIP; solid renter incomes; 271 units permitted in Imperial County in 2024 (112 in 5+ unit buildings).
Forward outlook
- Local home prices are declining (-3.0%/yr); year-one equity from $622 of loan paydown is wiped out by about $3k of value loss. Plan a longer hold.
- Imperial County population projected at +7% by 2050 — modest demand growth; plan on rents tracking national, not racing it.
- At projected returns (-3.0% appreciation + 3.0% rent growth), your $25k cash investment doubles in ~4 years — after that, you're playing with house money.
Negotiation context
- It's been on market 217 days — a 12% lower offer ($79k) is reasonable based on typical stale-listing flexibility.
- 2 sale attempts; this cycle's ask has dropped $70k (44%) from the opening price — seller is motivated, your offer sets the floor, not the list.
Risks & watch-outs
- Watch-outs: built in 1920 — expect roof / HVAC / electrical / plumbing capex.
- Climate carrying-cost: extreme-heat days projected 7→22/yr by 2055 (HVAC capex compounding) — expect insurance premiums to compound above CPI over the hold.
Questions for the listing agent
- It's been on market 217 days. Have you received any prior offers? Is the seller open to a 12% concession, seller financing, or rate buy-down credit?
- Built in 1920 — when were the roof, HVAC, electrical panel, plumbing, and water heater last replaced?
- Why hasn't it sold? Are there any deal-killer items the seller is aware of (foundation, flood, title, zoning, code violations)?
- Is there a deadline driving the sale (1031 exchange, divorce, estate, relocation)? That informs how much negotiation room exists.
- What's the average days-on-market for RENTAL listings here right now (not sales)? A rising rental-DOM trend means longer vacancies and softer asking-rent achievability than the comps imply.
- What's the recent tenant-quality profile in this submarket — average credit score on applications, eviction rate, late-payment / NSF rate, and stable-employment percentage? A property-management company in the area should have these aggregated.
- How much new for-sale + rental construction is in the pipeline within 1–3 miles? Heavy new supply typically softens prices + rents 12–24 months out; constrained supply supports both.
Investment metrics
- 1% rule
- 1.78% ✓
- Cap rate
- 15.32%
- Cash-on-cash
- 32.25%
- DSCR
- 2.43
- GRM
- 4.7
CMA / ARV
No comps found within radius.
Projected returns pro-forma
-3.0% appreciation · 3.0% rent growth · sell at horizon
- IRR
- 27.3%
- Equity multiple
- 2.13×
- Total profit
- $28,554
- Equity at exit
- $13,419
- IRR
- 34.8%
- Equity multiple
- 4.19×
- Total profit
- $80,424
- Equity at exit
- $7,782
Cash invested: $25,200 (down + closing). Projections, not guarantees.
Landlord ↔ Tenant lean methodology
- Overall (STATE)
- 18 Strongly Tenant-Friendly
- State California
- 18 Strongly Tenant-Friendly · D+13
- County
- — inherits STATE
- City
- — inherits STATE
ZIP-level market 92251
- Home prices YoY
- -9.8%
- Active inventory
- 120
- Price-to-rent
- 4.7×
Monthly cashflow live
- Estimated rent
- $1,605 medium interval (Pro) →
- Mortgage (P&I)
- −$472
- Tax from tax record
- −$81 /mo · $976/yr
- Insurance
- −$38
- HOA
- −$0
- Vacancy / Maint / Mgmt
- −$337
- Net cashflow
- $677
Break-even live
Sensitivity live
| Price | -10% $728 | -5% $703 | +0% $677 | +5% $652 | +10% $626 |
|---|---|---|---|---|---|
| Rent | -10% $550 | -5% $614 | +0% $677 | +5% $741 | +10% $804 |
| Rate | -1.0pp $723 | -0.5pp $700 | base $677 | +0.5pp $654 | +1.0pp $630 |
UW: 25.0% down · 7.5% · 30yr · 1.5% tax · 5.0% vac · 8.0% maint · 8.0% mgmt
Financing live
Cash to close
- Down payment
- $22,500
- Closing costs
- $2,700
- Reserves months
- —
- Total cash needed
- —
Loan-product check · same deal, 3 products live
Conventional
25% down · 7.5% · 30yr
- Down + closing
- —
- Monthly P&I
- —
- Monthly cashflow
- —
- DSCR
- —
- Eligible?
- —
Personal DTI + credit; lowest rate.
DSCR
20% down · 8.5% · 30yr
- Down + closing
- —
- Monthly P&I
- —
- Monthly cashflow
- —
- DSCR
- —
- Eligible?
- —
No personal income docs; deal must DSCR.
Hard money
10% down · 12.0% · 12mo
- Down + closing
- —
- Monthly P&I
- —
- Monthly cashflow
- —
- DSCR
- —
- Eligible?
- —
Short-term bridge; refi at stabilization.
Listing history 5 events
-
2026-02-13status Pending
-
2026-01-14price $90,000
-
2026-01-09status Active
-
2025-08-29price $120,000
-
2025-05-31$160,000 Active
ⓘ Source: listings_history table (triggers on properties + properties_extension) + one-shot
backfill from property_details.listing_events for pre-trigger history.
Tax reassessment forecast CA · Resets to sale price
- Current annual tax
- $976 · $81/mo
- Projected year-2 tax
- $976 · $81/mo
- Expected delta
- $0/yr ($0/mo · -0.0%)
ⓘ Screening estimate from a state-policy table — verify with the county assessor before closing.
Climate risk First Street
- Flood 1/10 Low FEMA zone X (unshaded) · 0% chance over 30 yrs
- Wildfire 3/10 Moderate
- Heat 10/10 Extreme 7 d/yr ≥114°F today · 22 d/yr by 30 yrs out
- Wind 1/10 Low
- Air quality 3/10 Moderate 2 unhealthy d/yr today · 3 by 30 yrs out
Nearby sold comps map
Loading sold comps map…
Walkable amenities ~0.75 mi
Loading nearby amenities…
Taxation est. · year 1
- Rental income
- $19,260
- − Mortgage interest
- −$5,041
- − Property taxes
- −$976
- − Insurance
- −$450
- − Repairs & maintenance
- −$1,541
- − Management
- −$1,541
- − Depreciation
- −$2,618
- Taxable income
- $7,094
- Est. tax owed @ 24.0%
- −$1,702
- After-tax cash flow
- $6,424/yr
For passive investors: Depreciation is non-cash, so a rental often shows a tax loss while cash-flowing — sheltering income. Rental losses are passive: they offset passive income freely, and up to $25,000/yr can offset ordinary (W-2) income if you actively participate and your MAGI is under $100k (phasing out to $0 by $150k); unused losses carry forward. On sale, claimed depreciation is recaptured at up to 25%, and gains may owe capital-gains tax (a 1031 exchange can defer both). Figures are a year-1 estimate at your 24.0% rate — not tax advice; consult a CPA.
Schools (NCES district)
- District
- Imperial Unified
- NCES district ID
- 0618210
- Math proficiency
- 21% ▼ -21.00%
- Reading proficiency
- 44% ▼ -16.00%
- Median HH income
- $66,775
- Composite
- 29.79/100
- National rank
- #6424
- State rank
- #281 of 517 in CA
Livability — Imperial
- Score
- 68/100
- State rank
- #286
- US rank
- #9731
Category grades
Schools grade is shown separately in the Schools card above.
Census & demographics
- Census place
- Imperial, CA
- County
- Imperial County · 104,838 people
- City population
- 27,454
- Metro
- El Centro, CA
- Population (ZIP)
- 27,454
- Household income
- $90,709
- Rent vs Own
- Severe rent burden
- 410.0
Population outlook (Imperial County) Hauer SSP2
- Today (2025)
- 186,713 people
- By 2030
- 190,022 · +1.8%
- By 2040
- 195,993 · +5.0%
- By 2050
- 199,534 · +6.9%
- By 2075
- 216,878 · +16.2%
- By 2100
- 352,705 · +88.9%
Race, ethnicity, and origin ACS 2023
- Neighborhood character
- Predominantly Hispanic (83%)
- Race & ethnicity
- Hispanic / Latino 83% Two or more races 30% White 10% Asian 3% Black 3%
- Hispanic origin (detail)
- Mexican 80%
- Common ancestry
- Slovak 1%
- Foreign-born
- 24% · Canada, South Korea, Vietnam
- Languages at home
- 34% English-only · Spanish 63% Korean 1% Arabic 1%
Political lean MEDSL · Imperial
- 2024 margin
- Toss-up / Even · D 48.3% · R 49.1% · Other 2.6%
- 2008→2024 swing
- -27.0pp toward R · 2008: 26.2pp · 2024: -0.9pp
- All cycles
- 2024: R+0.9 2020: D+24.4 2016: D+41.1 2012: D+28.8 2008: D+26.2
Not yet ingested
- Civics
- —
Market trends
- HPI YoY
- ▼ -41.26%
- Current HPI
- 380.9947
- Rent YoY
- —
- Metro
- El Centro, CA
- State GDP YoY
- ▲ 3.21%
- F500 in state
- 116
Industry mix (Fortune 500 HQ in CA)
| Industry | F500 HQs | Revenue |
|---|---|---|
| Technology | 27 | $1,492B |
|
||
| Financial Services | 3 | $174B |
|
||
| Retail | 3 | $44B |
|
||
| Insurance | 3 | $26B |
|
||
| Media / Entertainment | 2 | $115B |
|
||
| Pharmaceuticals / Biotech | 2 | $62B |
|
||
Price history
-43.8% since first listed5 events — show timeline
- 2026-02-13 Pending — ICAOR
- 2026-01-14 Price Changed $90,000 ICAOR
- 2026-01-09 Relisted — ICAOR
- 2025-08-29 Price Changed $120,000 ICAOR
- 2025-05-31 Listed $160,000 ICAOR
Property tax history
+15.8%/yrLatest (2025): $976 · +1.7% YoY. Source: county tax records.
Cash-flow waterfall
monthlySold comps — $/sqft
last 12 mo · ≤1 miLoading sold comps…