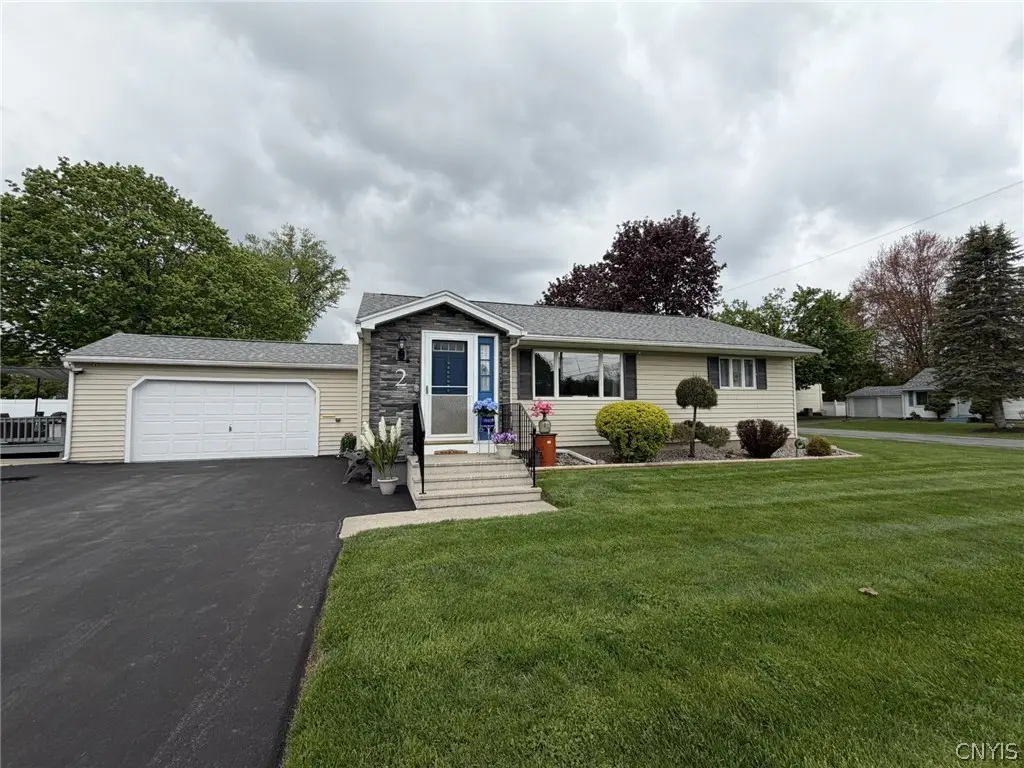
2 Scott Ave
New Hartford, NY 13413
$269,900D+
2 bd · 1.0 ba ·
1,320 sqft ·
Built 1953
· SingleFamily
· Pending
· 4 DOM
Cashflow @ list (25.0% down · 7.5%)
Estimated rent
$2,632/mo
Mortgage (P&I)
−$1,415
Tax + insurance
−$429
HOA
−$0
Vac / Maint / Mgmt
−$553
Net cashflow
$235/mo
Annual
$2,814/yr
Cap rate
7.34%
Cash-on-cash
3.72%
DSCR
1.17
1% rule
0.98%
Cash to close
$75,572
Investor read
- This is a 2-bed/1.0-bath single-family listed at $270k.
- At list price, monthly cash flow is $235 ($3k/yr) — positive.
- The deal already cash-flows at list — no discount required.
- To meet the 1% rule (rent ≥ 1% of price), the offer needs to be $263k (2.5% below list).
- Only 4 days on market — expect competitive offers; lowballing is unlikely to land.
- Recommended offer: $263k (2.5% below list) — sets the bar for 1% rule.
- Local home prices are declining (-3.0%/yr); year-one equity from $2k of loan paydown is wiped out by about $8k of value loss. Plan a longer hold.
- Location reads 78/100 on livability (#157 in NY, #2,420 nationally) — a middle-class / working-renter tenant base. Strengths: schools A+, crime A+, housing A+; Watch: amenities D-, commute F.
- New Hartford Central School District (suburban): math 65% / reading 76% proficiency, ranked #128 of 590 in NY (top 22%) — strong family-tenant draw, lease renewals of 3-5y typical; only 9% free/reduced lunch — higher-income household profile.
- Watch-outs: built in 1953 — expect roof / HVAC / electrical / plumbing capex.
- Market conditions: 100 active listings in the ZIP; 2 comparable units currently listed for rent nearby; solid renter incomes; 204 units permitted in Oneida County in 2024 (68 in 5+ unit buildings).
- Oneida County population projected at -12% by 2050 — secular population decline; favor cash flow + early exit over multi-decade hold.
- 3 sale attempts since 11y ago with the ask held roughly flat each time — persistent listings suggest the price (not the market) is what's stuck; bring a comps-based counter.
- Current owner paid $134k; list at $270k implies a 102% gain — meaningful room to come down on a strong offer.
- Climate carrying-cost: major flood risk — expect insurance premiums to compound above CPI over the hold.
- Cap rate 7.3% vs local median 3.8% in New Hartford — top-decile yield for the area; either an underpriced asset or a hidden risk that comps aren't pricing in. Stress-test before assuming the spread holds.
- This rent runs 33% of the median local income ($95k/yr) — at the standard rent-burdened threshold; future hikes will face affordability resistance.
Questions for listing agent
- Built in 1953 — when were the roof, HVAC, electrical panel, plumbing, and water heater last replaced?
- Is there a deadline driving the sale (1031 exchange, divorce, estate, relocation)? That informs how much negotiation room exists.
- Schools are A-rated — typically a magnet for longer-tenancy family renters. What's the average tenant stay here, and is there a school-zone premium baked into asking?
- The area grade is low — what's the realistic commute time and amenity access for the typical tenant pool here? Any planned neighborhood developments (good or bad) we should know about?
- What's the average days-on-market for RENTAL listings here right now (not sales)? A rising rental-DOM trend means longer vacancies and softer asking-rent achievability than the comps imply.
- What's the recent tenant-quality profile in this submarket — average credit score on applications, eviction rate, late-payment / NSF rate, and stable-employment percentage? A property-management company in the area should have these aggregated.
- How much new for-sale + rental construction is in the pipeline within 1–3 miles? Heavy new supply typically softens prices + rents 12–24 months out; constrained supply supports both.
CashFlowRE · CFR-200WGC940X2KJ2
· Data 3 weeks ago
cashflowre.app · 2026-05-29