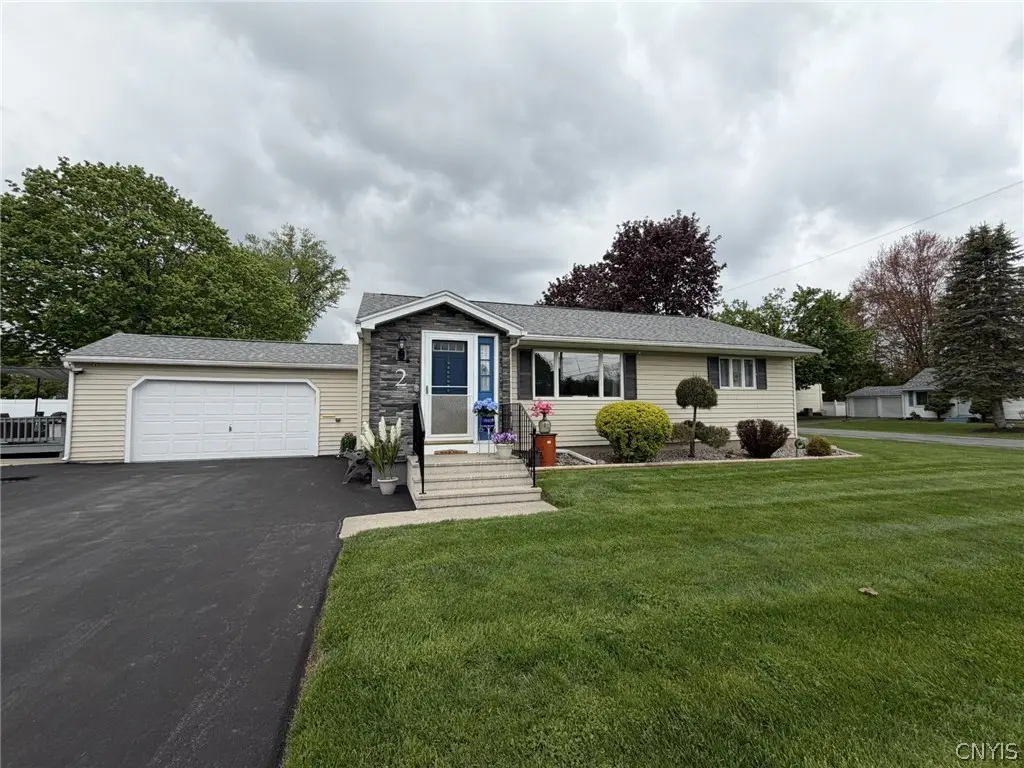
2 Scott Ave · New Hartford, NY
Flood risk 6/10 · Moderate
- FEMA flood zone
- X (unshaded)
- Chance of flooding over 30 yrs
- 0.7%
- Est. flood insurance / yr
- $473 – $860
Fire risk 1/10 · Minimal
- Est. fire insurance / yr
- $691 – $1,283
Heat risk 3/10 · Minor
- Hot days now (above 95°F)
- 7 days/yr
- Hot days in 30 yrs
- 17 days/yr
Wind risk 1/10 · Minimal
- Chance of severe wind over 30 yrs
- 1.0%
Air-quality risk 2/10 · Minimal
- Unhealthy air days now
- 0 days/yr
- Unhealthy air days in 30 yrs
- 2 days/yr
Risk factors via First Street. Map © Google.
Why this score? — see what drove the D+ grade
The composite is a weighted blend of 9 inputs, each scored 0–100. Each bar is that input's sub-score; the figure is the points it added to the 100-point composite (weight × sub-score).
- Cash flow +18.0/30.0
- Schools +6.1/10.0
- ARV discount +6.0/15.0
- DSCR +5.7/10.0
- 1% rule +4.8/10.0
- Livability +3.9/5.0
- Rent growth +2.5/5.0
- Condition / age +2.5/5.0
- Appreciation +0.0/10.0
$269,900
🖨 Deal sheet 📄 Offer letter ✓ Due diligence
Listing remarks MLS
Better put your running shoes on and get in quick! This 2 Bedroom ranch sits on large corner lot. Gleaming Hardwood floors, wonderful eat in kitchen & formal dining room. 11x25 family room/utility room addition with gas stove creates a cozy place for the family to gather Central Air too!
Key facts
- Hard wood floors
- First floor laundry
- Gas fireplace
Tags
Property features AI
Exterior
- Parking: Attached garage (1 car)
- Utilities: Public water connected; Sewer connected; High-speed internet available; Cable available; Electric with circuit breakers
- Home design: Single-story home; Vinyl siding; Asphalt roof; Block foundation; Existing/resale property; Road frontage on a main thoroughfare; Rectangular lot (approximately 135 x 70)
- Construction: Vinyl siding construction; Asphalt roof; Block foundation; Built as an existing/resale property
- Exterior features: Blacktop driveway; Deck (open); Porch; Partial fencing; Shed(s)/storage
Interior
- Kitchen: Dishwasher; Free-standing range; Oven; Refrigerator; Eat-in kitchen
- Bedrooms: Two main-level bedrooms
- Flooring: Carpet; Ceramic tile; Hardwood; Laminate; Varies
- Bathrooms: One full bathroom (main level)
- Heating & cooling: Gas forced-air heating; Central air conditioning
- Interior features: Ceiling fan(s); Entrance foyer; Eat-in kitchen; Separate/formal living room; Main level primary; Thermal windows; Full basement
- Laundry & utility: Washer; Dryer; Main-level laundry
Neighborhood map
What this means for you Summary
Snapshot
- This is a 2-bed/1.0-bath single-family listed at $270k.
Deal economics
- At list price, monthly cash flow is $235 ($3k/yr) — positive.
- The deal already cash-flows at list — no discount required.
- To meet the 1% rule (rent ≥ 1% of price), the offer needs to be $263k (2.5% below list).
- Recommended offer: $263k (2.5% below list) — sets the bar for 1% rule.
- Cap rate 7.3% vs local median 3.8% in New Hartford — top-decile yield for the area; either an underpriced asset or a hidden risk that comps aren't pricing in. Stress-test before assuming the spread holds.
Location & tenants
- Location reads 78/100 on livability (#157 in NY, #2,420 nationally) — a middle-class / working-renter tenant base. Strengths: schools A+, crime A+, housing A+; Watch: amenities D-, commute F.
- New Hartford Central School District (suburban): math 65% / reading 76% proficiency, ranked #128 of 590 in NY (top 22%) — strong family-tenant draw, lease renewals of 3-5y typical; only 9% free/reduced lunch — higher-income household profile.
- Market conditions: 100 active listings in the ZIP; 2 comparable units currently listed for rent nearby; solid renter incomes; 204 units permitted in Oneida County in 2024 (68 in 5+ unit buildings).
- This rent runs 33% of the median local income ($95k/yr) — at the standard rent-burdened threshold; future hikes will face affordability resistance.
Forward outlook
- Local home prices are declining (-3.0%/yr); year-one equity from $2k of loan paydown is wiped out by about $8k of value loss. Plan a longer hold.
- Oneida County population projected at -12% by 2050 — secular population decline; favor cash flow + early exit over multi-decade hold.
Negotiation context
- Only 4 days on market — expect competitive offers; lowballing is unlikely to land.
- 3 sale attempts since 11y ago with the ask held roughly flat each time — persistent listings suggest the price (not the market) is what's stuck; bring a comps-based counter.
- Current owner paid $134k; list at $270k implies a 102% gain — meaningful room to come down on a strong offer.
Risks & watch-outs
- Watch-outs: built in 1953 — expect roof / HVAC / electrical / plumbing capex.
- Climate carrying-cost: major flood risk — expect insurance premiums to compound above CPI over the hold.
Questions for the listing agent
- Built in 1953 — when were the roof, HVAC, electrical panel, plumbing, and water heater last replaced?
- Is there a deadline driving the sale (1031 exchange, divorce, estate, relocation)? That informs how much negotiation room exists.
- Schools are A-rated — typically a magnet for longer-tenancy family renters. What's the average tenant stay here, and is there a school-zone premium baked into asking?
- The area grade is low — what's the realistic commute time and amenity access for the typical tenant pool here? Any planned neighborhood developments (good or bad) we should know about?
- What's the average days-on-market for RENTAL listings here right now (not sales)? A rising rental-DOM trend means longer vacancies and softer asking-rent achievability than the comps imply.
- What's the recent tenant-quality profile in this submarket — average credit score on applications, eviction rate, late-payment / NSF rate, and stable-employment percentage? A property-management company in the area should have these aggregated.
- How much new for-sale + rental construction is in the pipeline within 1–3 miles? Heavy new supply typically softens prices + rents 12–24 months out; constrained supply supports both.
Investment metrics
- 1% rule
- 0.98% ✗
- Cap rate
- 7.34%
- Cash-on-cash
- 3.72%
- DSCR
- 1.17
- GRM
- 8.5
CMA / ARV
- ARV (on-the-fly)
- $261,360
- Comps found
- 12
Show comp detail 12 sales within ~0.75 mi
| Address | Dist | Beds/Ba | Sqft | Sold | Price | $/sf | Match |
|---|---|---|---|---|---|---|---|
| 5 Bonnie Ave | 0.10mi | 3/2.0 (+1) | 1,359 (+3%) | 7mo | $285,000 | $210 | 75 |
| 63 Higby Rd | 0.43mi | 2/1.5 | 1,328 (+1%) | 9mo | $201,000 | $151 | 69 |
| 54 Hartford Ter | 0.42mi | 3/1.0 (+1) | 1,352 (+2%) | 4mo | $100,000 | $74 | 68 |
| 12 Sherrill Ln | 0.23mi | 3/1.5 (+1) | 1,452 (+10%) | 0mo | $205,000 | $141 | 65 |
| 2816 Ferndale Pl | 0.33mi | 3/1.0 (+1) | 1,209 (-8%) | 5mo | $128,750 | $106 | 62 |
| 5 Park St | 0.50mi | 3/2.0 (+1) | 1,344 (+2%) | 8mo | $185,000 | $138 | 58 |
| 8 Janet | 0.60mi | 3/1.0 (+1) | 1,245 (-6%) | 0mo | $274,000 | $220 | 58 |
| 142 Farmington Rd | 0.47mi | 3/1.5 (+1) | 1,428 (+8%) | 2mo | $295,500 | $207 | 56 |
| 58 Sunnyside Dr | 0.28mi | 3/2.0 (+1) | 1,440 (+9%) | 9mo | $265,000 | $184 | 56 |
| 9 Overbrook Cres | 0.65mi | 3/1.5 (+1) | 1,414 (+7%) | 0mo | $300,000 | $212 | 50 |
| 23 Beechwood Rd | 0.55mi | 3/1.5 (+1) | 1,237 (-6%) | 8mo | $285,000 | $230 | 50 |
| 4 Overbrook Cres | 0.71mi | 3/1.5 (+1) | 1,488 (+13%) | 7mo | $295,000 | $198 | 32 |
Match score weights: distance 35% · size 25% · config 20% · recency 20%. Top-matched comps best support the ARV.
Projected returns pro-forma
-3.0% appreciation · 3.0% rent growth · sell at horizon
- IRR
- -10.4%
- Equity multiple
- 0.62×
- Total profit
- $-28,771
- Equity at exit
- $40,243
- IRR
- -1.1%
- Equity multiple
- 0.92×
- Total profit
- $-5,710
- Equity at exit
- $23,336
Cash invested: $75,572 (down + closing). Projections, not guarantees.
Landlord ↔ Tenant lean methodology
- Overall (STATE)
- 15 Strongly Tenant-Friendly
- State New York
- 15 Strongly Tenant-Friendly · D+10
- County
- — inherits STATE
- City
- — inherits STATE
ZIP-level market 13413
- Active inventory
- 100
- Price-to-rent
- 8.5×
Monthly cashflow live
- Estimated rent
- $2,632 medium interval (Pro) →
- Mortgage (P&I)
- −$1,415
- Tax from tax record
- −$317 /mo · $3,800/yr
- Insurance
- −$112
- HOA
- −$0
- Vacancy / Maint / Mgmt
- −$553
- Net cashflow
- $235
Break-even live
UW: 25.0% down · 7.5% · 30yr · 1.5% tax · 5.0% vac · 8.0% maint · 8.0% mgmt
Financing live
Cash to close
- Down payment
- $67,475
- Closing costs
- $8,097
- Reserves months
- —
- Total cash needed
- —
Loan-product check · same deal, 3 products live
Conventional
25% down · 7.5% · 30yr
- Down + closing
- —
- Monthly P&I
- —
- Monthly cashflow
- —
- DSCR
- —
- Eligible?
- —
Personal DTI + credit; lowest rate.
DSCR
20% down · 8.5% · 30yr
- Down + closing
- —
- Monthly P&I
- —
- Monthly cashflow
- —
- DSCR
- —
- Eligible?
- —
No personal income docs; deal must DSCR.
Hard money
10% down · 12.0% · 12mo
- Down + closing
- —
- Monthly P&I
- —
- Monthly cashflow
- —
- DSCR
- —
- Eligible?
- —
Short-term bridge; refi at stabilization.
Rent comps 2 comps
| Address | Beds | Baths | Sqft | Rent | $/sqft | DOM | Units | Dist |
|---|---|---|---|---|---|---|---|---|
| 11 Sanger Ave New Hartford, NY | 3.0 | 2.5 | 1852 | $3,750 | $2.02 | 43d | 1 | 0.36mi |
| 225 Thieme Pl Utica, NY | 3.0 | 2.0 | 1872 | $2,150 | $1.15 | 43d | 1 | 0.92mi |
Listing history 7 events
-
2026-05-12status Pending
-
2026-05-08$269,900 Active
-
2015-10-01soldstatus $133,900 294-char remark
Show marketing remark (294 chars)
Better put your running shoes on and get in quick! This 2 Bedroom ranch sits on large corner lot. Gleaming Hardwood floors, wonderful eat in kitchen & formal dining room. 11x25 family room/utility room addition with gas stove creates a cozy place for the family to gather Central Air too!
-
2015-09-18soldstatus $130,000
-
2015-06-15historical
Show marketing remark (294 chars)
Better put your running shoes on and get in quick! This 2 Bedroom ranch sits on large corner lot. Gleaming Hardwood floors, wonderful eat in kitchen & formal dining room. 11x25 family room/utility room addition with gas stove creates a cozy place for the family to gather Central Air too!
-
2015-06-15$139,900 294-char remark
Show marketing remark (294 chars)
Better put your running shoes on and get in quick! This 2 Bedroom ranch sits on large corner lot. Gleaming Hardwood floors, wonderful eat in kitchen & formal dining room. 11x25 family room/utility room addition with gas stove creates a cozy place for the family to gather Central Air too!
-
2015-06-05$149,000
ⓘ Source: listings_history table (triggers on properties + properties_extension) + one-shot
backfill from property_details.listing_events for pre-trigger history.
Tax reassessment forecast NY · Partial reset (capped growth)
- Current annual tax
- $3,800 · $317/mo
- Projected year-2 tax
- $4,181 · $348/mo
- Expected delta
- +$381/yr (+$32/mo · 10.0%)
ⓘ Screening estimate from a state-policy table — verify with the county assessor before closing.
Climate risk First Street
- Flood 6/10 Major FEMA zone X (unshaded) · 70% chance over 30 yrs
- Wildfire 1/10 Low
- Heat 3/10 Moderate 7 d/yr ≥95°F today · 17 d/yr by 30 yrs out
- Wind 1/10 Low 100% chance of damaging wind over 30 yrs
- Air quality 2/10 Low 0 unhealthy d/yr today · 2 by 30 yrs out
Nearby sold comps map
Loading sold comps map…
Walkable amenities ~0.75 mi
Loading nearby amenities…
Taxation est. · year 1
- Rental income
- $31,580
- − Mortgage interest
- −$15,119
- − Property taxes
- −$3,800
- − Insurance
- −$1,350
- − Repairs & maintenance
- −$2,526
- − Management
- −$2,526
- − Depreciation
- −$7,852
- Taxable loss
- −$1,592
- Est. tax savings @ 24.0%
- +$382
- After-tax cash flow
- $3,196/yr
For passive investors: Depreciation is non-cash, so a rental often shows a tax loss while cash-flowing — sheltering income. Rental losses are passive: they offset passive income freely, and up to $25,000/yr can offset ordinary (W-2) income if you actively participate and your MAGI is under $100k (phasing out to $0 by $150k); unused losses carry forward. On sale, claimed depreciation is recaptured at up to 25%, and gains may owe capital-gains tax (a 1031 exchange can defer both). Figures are a year-1 estimate at your 24.0% rate — not tax advice; consult a CPA.
Schools (NCES district)
- District
- New Hartford Central School District
- NCES district ID
- 3620370
- Math proficiency
- 65% ▼ -7.00%
- Reading proficiency
- 76% ▲ 5.00%
- Median HH income
- $67,028
- Composite
- 61.37/100
- National rank
- #769
- State rank
- #128 of 590 in NY
Livability — New Hartford
- Score
- 78/100
- State rank
- #157
- US rank
- #2420
Category grades
Schools grade is shown separately in the Schools card above.
Census & demographics
- Census place
- New Hartford, NY
- County
- Oneida County · 89,710 people
- City population
- 16,742
- Metro
- Utica-Rome, NY
- Population (ZIP)
- 16,742
- Household income
- $95,261
- Rent vs Own
- Severe rent burden
- 395.0
Population outlook (Oneida County) Hauer SSP2
- Today (2025)
- 225,223 people
- By 2030
- 220,384 · -2.1%
- By 2040
- 209,071 · -7.2%
- By 2050
- 197,920 · -12.1%
- By 2075
- 175,541 · -22.1%
- By 2100
- 148,491 · -34.1%
Race, ethnicity, and origin ACS 2023
- Neighborhood character
- Predominantly White (88%)
- Race & ethnicity
- White 88% Asian 4% Hispanic / Latino 3% Two or more races 3%
- Common ancestry
- Romanian 8% Lithuanian 4% Subsaharan African 3%
- Foreign-born
- 11% · Vietnam, China, Canada
- Languages at home
- 86% English-only · Other Indo-European 4% Other Asian/Pacific 3% Russian/Polish/Slavic 2%
Political lean MEDSL · Oneida
- 2024 margin
- Strong R (+21.3) · D 39.4% · R 60.6%
- 2008→2024 swing
- -15.2pp toward R · 2008: -6.1pp · 2024: -21.3pp
- All cycles
- 2024: R+21.3 2020: R+15.5 2016: R+21.1 2012: R+5.3 2008: R+6.1
Not yet ingested
- Civics
- —
Market trends
- HPI YoY
- ▼ -210.17%
- Current HPI
- 295.4235
- Rent YoY
- —
- Metro
- Utica-Rome, NY
- State GDP YoY
- ▲ 2.60%
- F500 in state
- 92
Industry mix (Fortune 500 HQ in NY)
| Industry | F500 HQs | Revenue |
|---|---|---|
| Financial Services | 10 | $950B |
|
||
| Consumer Goods | 9 | $162B |
|
||
| Insurance | 4 | $225B |
|
||
| Telecommunications | 2 | $144B |
|
||
| Pharmaceuticals | 2 | $112B |
|
||
| Media / Entertainment | 2 | $69B |
|
||
Price history
+81.1% since first listed7 events — show timeline
- 2026-05-12 Pending — CNYIS
- 2026-05-08 Listed $269,900 CNYIS
- 2015-10-01 Sold (MLS) $133,900 CNYIS
- 2015-09-18 Sold (Public Records) $130,000 Public Records
- 2015-06-15 Listed $139,900 CNYIS
- 2015-06-15 Listing Removed — CNYIS
- 2015-06-05 Listed $149,000 CNYIS
Property tax history
+7.3%/yrLatest (2025): $3,800 · -6.9% YoY. Source: county tax records.
Cash-flow waterfall
monthlySold comps — $/sqft
last 12 mo · ≤1 miLoading sold comps…