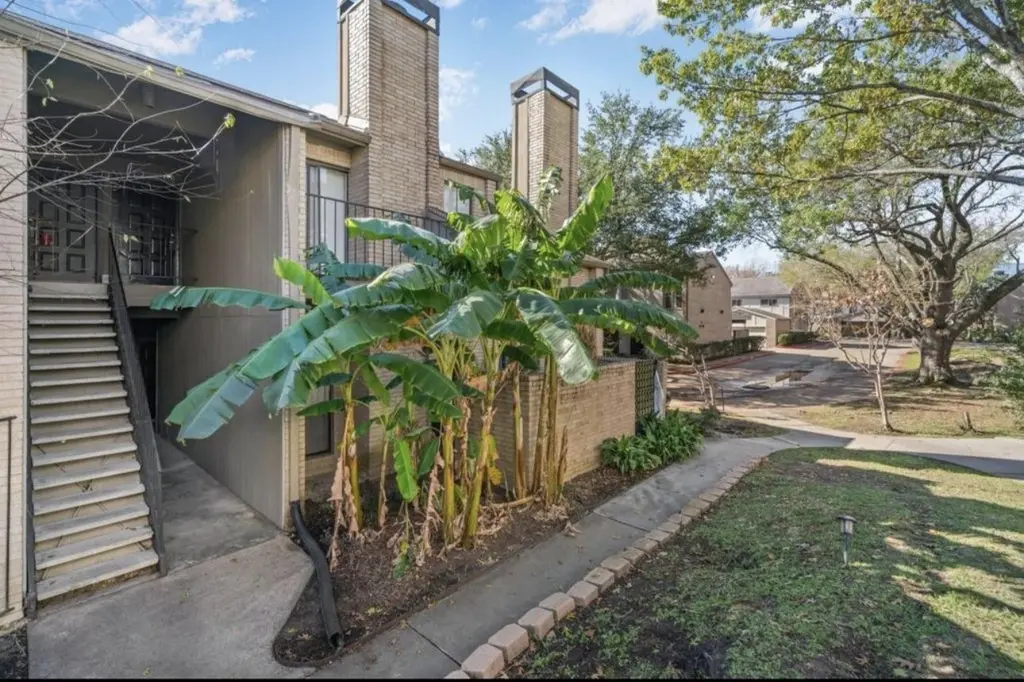
10811 Richmond Ave #72
Houston, TX 77042
$102,500D
1 bd · 1.0 ba ·
822 sqft ·
Built 1983
· Condo
· Active
· 11 DOM
Cashflow @ list (25.0% down · 7.5%)
Estimated rent
$1,189/mo
Mortgage (P&I)
−$538
Tax + insurance
−$222
HOA
−$261
Vac / Maint / Mgmt
−$250
Net cashflow
$-81/mo
Annual
$-975/yr
Cap rate
5.34%
Cash-on-cash
-3.40%
DSCR
0.85
1% rule
1.16%
Cash to close
$28,700
Investor read
- This is a 1-bed/1.0-bath condo listed at $102k.
- At list price, monthly cash flow is $-81 ($-975/yr) — negative.
- To cash-flow at today's rent, offer at most $88k (14.0% below list).
- Meets the 1% rule at list price ($1k rent vs $102k).
- Only 11 days on market — expect competitive offers; lowballing is unlikely to land.
- Recommended offer: $88k (14.0% below list) — sets the bar for cash-flow.
- Local home prices are declining (-3.0%/yr); year-one equity from $709 of loan paydown is wiped out by about $3k of value loss. Plan a longer hold.
- Location reads 74/100 on livability (#184 in TX, #4,771 nationally) — a middle-class / working-renter tenant base. Strengths: amenities A+, cost of living A+, housing A+; Watch: crime F.
- Alief ISD (urban): math 23% / reading 28% proficiency, ranked #717 of 826 in TX (top 87%) — low school quality limits family demand, transient renter base, plan for 1-2y turnover; 74% free/reduced lunch — lower-income household profile, screen leases tightly.
- Zoned schools: Outley El (math 26% / reading 36%, grade F, #2,429 of 4,322 statewide, top 57%, 829 students, 84% FRL); O'Donnell Middle (math 32% / reading 33%, grade F, #947 of 1,662 statewide, top 58%, 1,230 students, 89% FRL); Alief Isd J J A E P (13 students, 77% FRL).
- Watch-outs: HOA is 22% of rent.
- Market conditions: Rents soft (-2.3%/yr); 249 active listings in the ZIP; 40 comparable units currently listed for rent nearby; rentals at typical pace (median 18d on market — plan ~3-4 weeks tenant-placement turnaround); 29,883 units permitted in Harris County in 2024 (8,621 in 5+ unit buildings).
- Harris County population projected at +47% by 2050 — long-run rental-demand tailwind backs the buy-and-hold thesis.
- 6 sale attempts since 24y ago with the ask held roughly flat each time — persistent listings suggest the price (not the market) is what's stuck; bring a comps-based counter.
- Climate carrying-cost: severe wind risk, 99% chance of damaging wind over 30y; extreme-heat days projected 7→23/yr by 2055 (HVAC capex compounding) — expect insurance premiums to compound above CPI over the hold.
- Cap rate 5.3% vs local median 3.1% in Houston — top-decile yield for the area; either an underpriced asset or a hidden risk that comps aren't pricing in. Stress-test before assuming the spread holds.
Questions for listing agent
- What do current leases actually rent for vs. the listed asking? Can we see a recent rent roll and the last 12 months of T-12 income?
- What does the HOA fee cover, when was the last increase, and are there any pending special assessments or reserve-fund shortfalls?
- Any open or pending special assessments — roof, HVAC, plumbing, elevator, façade? What's the per-unit balance and payoff schedule, and is the seller paying it off at close or rolling it to the buyer?
- Is there a deadline driving the sale (1031 exchange, divorce, estate, relocation)? That informs how much negotiation room exists.
- Schools are D-rated, which usually means shorter tenancies and higher turnover. Who's the typical renter profile here, and what's been the actual vacancy rate?
- Crime grade is F in this area — have there been break-ins, vandalism, or insurance claims at this property in the last 3 years? What carrier currently insures it and at what premium?
- The area grade is low — what's the realistic commute time and amenity access for the typical tenant pool here? Any planned neighborhood developments (good or bad) we should know about?
- What's the average days-on-market for RENTAL listings here right now (not sales)? A rising rental-DOM trend means longer vacancies and softer asking-rent achievability than the comps imply.
CashFlowRE · CFR-21QYNF4YWD3SN8
· Data 1 day ago
cashflowre.app · 2026-05-29