10811 Richmond Ave #72 · Houston, TX
Flood risk 4/10 · Minor
- FEMA flood zone
- X (unshaded)
- Chance of flooding over 30 yrs
- 0.22%
- Est. flood insurance / yr
- $507 – $1,088
Fire risk 1/10 · Minimal
- Est. fire insurance / yr
- $1,222 – $2,270
Heat risk 9/10 · Severe
- Hot days now (above 110°F)
- 7 days/yr
- Hot days in 30 yrs
- 23 days/yr
Wind risk 9/10 · Severe
- Chance of severe wind over 30 yrs
- 99.0%
Air-quality risk 2/10 · Minimal
- Unhealthy air days now
- 2 days/yr
- Unhealthy air days in 30 yrs
- 2 days/yr
Risk factors via First Street. Map © Google.
Why this score? — see what drove the D grade
The composite is a weighted blend of 9 inputs, each scored 0–100. Each bar is that input's sub-score; the figure is the points it added to the 100-point composite (weight × sub-score).
- ARV discount +14.1/15.0
- Cash flow +8.8/30.0
- 1% rule +6.5/10.0
- Livability +3.7/5.0
- Condition / age +2.5/5.0
- DSCR +2.4/10.0
- Schools +2.1/10.0
- Rent growth +1.9/5.0
- Appreciation +0.0/10.0
$102,500
🖨 Deal sheet (PDF) 📄 Offer letter ✓ Due diligence
Listing remarks
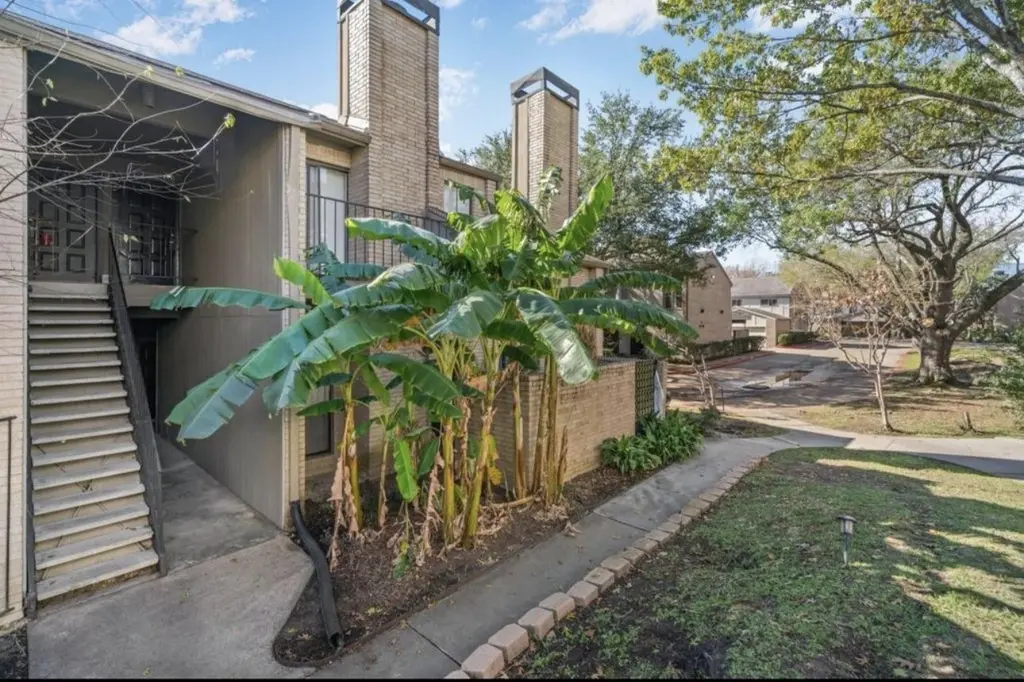
REDUCED AND PRICED TO SELL COME SEE THIS FANTASTIC UNIT!!!!! Don’t miss this wonderful opportunity in the Westchase District. This spacious 1-bedroom, 1-bathroom unit, offers a large living space and features two oversized closets, a relaxing garden tub, and your own private garage. Located on the second floor, enjoy your private balcony with a beautiful view. Situated in a gated community with two swimming pools and 24/7 surveillance throughout the property, this condo offers comfort, convenience, and peace of mind. Investors welcome, First-time homebuyers welcome, Low HOA with excellent coverage Property is professionally maintained. Minutes from beltway 8, and Westpark!! Don’
Key facts
- Gated community
- Two swimming pools
- Private balcony
Tags
Property features AI
Finance
- Other: Living area reported as 822; Lot recorded in square feet (109,092)
- HOA & community: HOA (Rise) with $261 monthly fee covering cable TV, grounds maintenance, sewer and water
Exterior
- Utilities: Public water; Public sewer
- Home design: Residential property; Single-story; Fronting composition roof
- Construction: Built in 1983; Stone construction; Slab foundation
- Exterior features: Community pool
Interior
- Bathrooms: 1 full bathroom
- Heating & cooling: Central heating (electric); Central air conditioning (electric)
- Interior features: One fireplace; Total of 1 room
Neighborhood map
What this means for you Summary
Snapshot
- This is a 1-bed/1.0-bath condo listed at $102k.
Deal economics
- At list price, monthly cash flow is $-85 ($-1k/yr) — negative.
- To cash-flow at today's rent, offer at most $87k (14.7% below list).
- Meets the 1% rule at list price ($1k rent vs $102k).
- Recommended offer: $87k (14.7% below list) — sets the bar for cash-flow.
- Cap rate 5.3% vs local median 3.2% in Houston — top-decile yield for the area; either an underpriced asset or a hidden risk that comps aren't pricing in. Stress-test before assuming the spread holds.
Location & tenants
- Location reads 74/100 on livability (#184 in TX, #4,771 nationally) — a middle-class / working-renter tenant base. Strengths: amenities A+, cost of living A+, housing A+; Watch: crime F.
- Alief ISD (urban): math 23% / reading 28% proficiency, ranked #717 of 826 in TX (top 87%) — low school quality limits family demand, transient renter base, plan for 1-2y turnover; 74% free/reduced lunch — lower-income household profile, screen leases tightly.
- Zoned schools: Outley El (math 26% / reading 36%, grade F, #2,429 of 4,322 statewide, top 57%, 829 students, 84% FRL); O'Donnell Middle (math 32% / reading 33%, grade F, #947 of 1,662 statewide, top 58%, 1,230 students, 89% FRL); Alief Isd J J A E P (13 students, 77% FRL).
- Market conditions: Rents soft (-2.3%/yr); 249 active listings in the ZIP; 40 comparable units currently listed for rent nearby; rentals at typical pace (median 15d on market — plan ~3-4 weeks tenant-placement turnaround); 29,883 units permitted in Harris County in 2024 (8,621 in 5+ unit buildings).
Forward outlook
- Local home prices are declining (-3.0%/yr); year-one equity from $709 of loan paydown is wiped out by about $3k of value loss. Plan a longer hold.
- Harris County population projected at +47% by 2050 — long-run rental-demand tailwind backs the buy-and-hold thesis.
Negotiation context
- Only 11 days on market — expect competitive offers; lowballing is unlikely to land.
- 6 sale attempts since 24y ago with the ask held roughly flat each time — persistent listings suggest the price (not the market) is what's stuck; bring a comps-based counter.
Risks & watch-outs
- Watch-outs: HOA is 22% of rent.
- Climate carrying-cost: severe wind risk, 99% chance of damaging wind over 30y; extreme-heat days projected 7→23/yr by 2055 (HVAC capex compounding) — expect insurance premiums to compound above CPI over the hold.
Questions for the listing agent
- What do current leases actually rent for vs. the listed asking? Can we see a recent rent roll and the last 12 months of T-12 income?
- What does the HOA fee cover, when was the last increase, and are there any pending special assessments or reserve-fund shortfalls?
- Any open or pending special assessments — roof, HVAC, plumbing, elevator, façade? What's the per-unit balance and payoff schedule, and is the seller paying it off at close or rolling it to the buyer?
- Is there a deadline driving the sale (1031 exchange, divorce, estate, relocation)? That informs how much negotiation room exists.
- Schools are D-rated, which usually means shorter tenancies and higher turnover. Who's the typical renter profile here, and what's been the actual vacancy rate?
- Crime grade is F in this area — have there been break-ins, vandalism, or insurance claims at this property in the last 3 years? What carrier currently insures it and at what premium?
- The area grade is low — what's the realistic commute time and amenity access for the typical tenant pool here? Any planned neighborhood developments (good or bad) we should know about?
- What's the average days-on-market for RENTAL listings here right now (not sales)? A rising rental-DOM trend means longer vacancies and softer asking-rent achievability than the comps imply.
- What's the recent tenant-quality profile in this submarket — average credit score on applications, eviction rate, late-payment / NSF rate, and stable-employment percentage? A property-management company in the area should have these aggregated.
- How much new apartment / multifamily construction is in the pipeline within 1–3 miles? Heavy new supply (>2% of stock underway) typically softens rents 12–24 months out; light construction supports rent growth.
Investment metrics
- 1% rule
- 1.15% ✓
- Cap rate
- 5.30%
- Cash-on-cash
- -3.56%
- DSCR
- 0.84
- GRM
- 7.2
CMA / ARV
- ARV (median comp)
- $120,248
- List price
- $102,500
- Delta
- -8.52%
- Verdict
- FAIR
- Comps
- 20 within 1.0 mi
Projected returns pro-forma
-3.0% appreciation · 0.0% rent growth · sell at horizon
- IRR
- -27.2%
- Equity multiple
- 0.12×
- Total profit
- $-25,289
- Equity at exit
- $15,283
- IRR
- -53.6%
- Equity multiple
- -0.45×
- Total profit
- $-41,555
- Equity at exit
- $8,862
Cash invested: $28,700 (down + closing). Projections, not guarantees.
Landlord ↔ Tenant lean methodology
- Overall (STATE)
- 87 Strongly Landlord-Friendly
- State Texas
- 87 Strongly Landlord-Friendly · R+5
- County
- — inherits STATE
- City
- — inherits STATE
ZIP-level market 77042
- Rents YoY
- -2.3%
- Active inventory
- 249
- Price-to-rent
- 7.2×
Monthly cashflow live
- Estimated rent
- $1,184 high interval (Pro) →
- Mortgage (P&I)
- −$538
- Tax from tax record
- −$179 /mo · $2,148/yr
- Insurance
- −$43
- HOA
- −$261
- Vacancy / Maint / Mgmt
- −$249
- Net cashflow
- $-85
Break-even live
Sensitivity live
| Price | -10% $-27 | -5% $-56 | +0% $-85 | +5% $-114 | +10% $-143 |
|---|---|---|---|---|---|
| Rent | -10% $-179 | -5% $-132 | +0% $-85 | +5% $-38 | +10% $8 |
| Rate | -1.0pp $-33 | -0.5pp $-59 | base $-85 | +0.5pp $-112 | +1.0pp $-139 |
UW: 25.0% down · 7.5% · 30yr · 1.5% tax · 5.0% vac · 8.0% maint · 8.0% mgmt
Financing live
Cash to close
- Down payment
- $25,625
- Closing costs
- $3,075
- Reserves months
- —
- Total cash needed
- —
Loan-product check · same deal, 3 products live
Conventional
25% down · 7.5% · 30yr
- Down + closing
- —
- Monthly P&I
- —
- Monthly cashflow
- —
- DSCR
- —
- Eligible?
- —
Personal DTI + credit; lowest rate.
DSCR
20% down · 8.5% · 30yr
- Down + closing
- —
- Monthly P&I
- —
- Monthly cashflow
- —
- DSCR
- —
- Eligible?
- —
No personal income docs; deal must DSCR.
Hard money
10% down · 12.0% · 12mo
- Down + closing
- —
- Monthly P&I
- —
- Monthly cashflow
- —
- DSCR
- —
- Eligible?
- —
Short-term bridge; refi at stabilization.
Rent comps 40 comps
| Address | Beds | Baths | Sqft | Rent | $/sqft | DOM | Units | Dist |
|---|---|---|---|---|---|---|---|---|
| 10777 Richmond Ave Houston, TX | 1.0 | 1.0 | 625 | $1,260 | $2.02 | 14d | 1 | 0.10mi |
| 10777 Richmond Ave Houston, TX | 1.0–2.0 | 1.0–2.0 | 975 | $1,249 | $1.28 | 0d | 20 | 0.10mi |
| 10777 Richmond Ave Unit 10814 Houston, TX | 2.0 | 2.0 | 1117 | $1,672 | $1.50 | 14d | 1 | 0.12mi |
| 10777 Richmond Ave Unit 10798 Houston, TX | 1.0 | 1.0 | 625 | $1,311 | $2.10 | 14d | 1 | 0.12mi |
| 10777 Richmond Ave Unit 10798 Houston, TX | 1.0 | 1.0 | 625 | $1,306 | $2.09 | 14d | 1 | 0.12mi |
| 10777 Richmond Ave Unit 2174 Houston, TX | 2.0 | 2.0 | 1117 | $1,621 | $1.45 | 14d | 1 | 0.12mi |
| 3411 Walnut Bend Ln Houston, TX | 1.0–3.0 | 1.0–2.0 | 962 | $965 | $1.00 | 1d | 13 | 0.13mi |
| 10881 Richmond Ave Unit 1004 Houston, TX | 2.0 | 2.0 | 885 | $1,170 | $1.32 | 26d | 1 | 0.20mi |
| 10881 Richmond Ave Unit 212 Houston, TX | 1.0 | 1.0 | 570 | $935 | $1.64 | 45d | 1 | 0.20mi |
| 10881 Richmond Ave Unit 1209 Houston, TX | 2.0 | 2.0 | 885 | $1,130 | $1.28 | 26d | 1 | 0.20mi |
| 10881 Richmond Ave Unit 702 Houston, TX | 2.0 | 1.0 | 804 | $1,080 | $1.34 | 26d | 1 | 0.20mi |
| 10881 Richmond Ave Unit 206 Houston, TX | 1.0 | 1.0 | 570 | $900 | $1.58 | 45d | 1 | 0.20mi |
| 3035 Walnut Bend Ln Houston, TX | 2.0 | 2.0 | 1075 | $1,100 | $1.02 | 20d | 1 | 0.22mi |
| 10887 Richmond Ave Houston, TX | 2.0 | 2.0 | 885 | $1,125 | $1.27 | 45d | 1 | 0.22mi |
| 10887 Richmond Ave Houston, TX | 1.0 | 1.0 | 570 | $917 | $1.61 | 26d | 1 | 0.22mi |
| 10887 Richmond Ave Houston, TX | 2.0 | 2.0 | 885 | $1,125 | $1.27 | 24d | 1 | 0.22mi |
| 10751 Meadowglen Ln Houston, TX | 2.0 | 1.0–2.0 | 763 | $1,229 | $1.61 | 0d | 19 | 0.24mi |
| 3354 Rogerdale Rd Houston, TX | 1.0 | 1.0 | 798 | $1,260 | $1.58 | 17d | 1 | 0.31mi |
| 3354 Rogerdale Rd Unit 2165 Houston, TX | 2.0 | 2.0 | 1124 | $1,524 | $1.36 | 1d | 1 | 0.31mi |
| 3354 Rogerdale Rd Unit 3405 Houston, TX | 1.0 | 1.0 | 692 | $1,029 | $1.49 | 12d | 1 | 0.31mi |
| 3354 Rogerdale Rd Unit 3375 Houston, TX | 1.0 | 1.0 | 798 | $1,295 | $1.62 | 14d | 1 | 0.31mi |
| 3354 Rogerdale Rd Unit 325 Houston, TX | 1.0 | 1.0 | 692 | $979 | $1.41 | 1d | 1 | 0.31mi |
| 3354 Rogerdale Rd Apt 321 Houston, TX | 1.0 | 1.0 | 692 | $990 | $1.43 | 9d | 1 | 0.31mi |
| 3354 Rogerdale Rd Unit 2148 Houston, TX | 2.0 | 2.0 | 1124 | $1,565 | $1.39 | 1d | 1 | 0.31mi |
| 3354 Rogerdale Rd Unit 422 Houston, TX | 2.0 | 2.0 | 1124 | $1,540 | $1.37 | 9d | 1 | 0.31mi |
| 3354 Rogerdale Rd Unit 3411 Houston, TX | 2.0 | 2.0 | 1016 | $1,490 | $1.47 | 45d | 1 | 0.31mi |
| 3354 Rogerdale Rd Unit 3391 Houston, TX | 2.0 | 2.0 | 1124 | $1,564 | $1.39 | 12d | 1 | 0.31mi |
| 10615 Meadowglen Ln Unit 2162 Houston, TX | 2.0 | 2.0 | 897 | $1,140 | $1.27 | 7d | 1 | 0.31mi |
| 10615 Meadowglen Ln Unit 10672 Houston, TX | 2.0 | 2.0 | 897 | $1,124 | $1.25 | 1d | 1 | 0.31mi |
| 10615 Meadowglen Ln Unit 422 Houston, TX | 2.0 | 2.0 | 897 | $1,140 | $1.27 | 9d | 1 | 0.31mi |
| 10851 Meadowglen Ln Houston, TX | 2.0 | 2.0 | 1080 | $1,835 | $1.70 | 14d | 1 | 0.33mi |
| 10621 Meadowglen Ln Houston, TX | 2.0 | 2.0 | 897 | $1,075 | $1.20 | 45d | 1 | 0.37mi |
| 10621 Meadowglen Ln Houston, TX | 1.0 | 1.0 | 800 | $925 | $1.16 | 26d | 1 | 0.37mi |
| 10621 Meadowglen Ln Houston, TX | 2.0 | 2.0 | 897 | $1,075 | $1.20 | 24d | 1 | 0.37mi |
| 10901 Meadowglen Ln Unit 202A Houston, TX | 1.0 | 1.0 | 767 | $850 | $1.11 | 17d | 1 | 0.38mi |
| 10901 Meadowglen Ln Unit 335B Houston, TX | 2.0 | 2.0 | 976 | $1,180 | $1.21 | 17d | 1 | 0.38mi |
| 10901 Meadowglen Ln Unit 163A Houston, TX | 1.0 | 1.0 | 531 | $749 | $1.41 | 17d | 1 | 0.38mi |
| 10901 Meadowglen Ln Unit 236A Houston, TX | 1.0 | 1.0 | 661 | $874 | $1.32 | 26d | 1 | 0.38mi |
| 10901 Meadowglen Ln Unit 229 Houston, TX | 1.0 | 1.5 | 661 | $825 | $1.25 | 24d | 1 | 0.38mi |
| 10901 Meadowglen Ln Apt 311 Houston, TX | 1.0 | 1.0 | 531 | $649 | $1.22 | 1d | 1 | 0.38mi |
HOA detail condo
- Monthly dues
- $261 · $3,132/yr
- Likely covers
- poolsecurity
- Assessments
- None detected in remarks — confirm with the listing agent.
Listing history 29 events
-
2026-06-21days on market $102,500 Active 11 DOM
-
2026-06-18days on market $102,500 Active 8 DOM
-
2026-06-17days on market $102,500 Active 7 DOM
-
2026-06-16days on market $102,500 Active 6 DOM
-
2026-06-15days on market $102,500 Active 5 DOM
-
2026-06-13days on market $102,500 Active 3 DOM
-
2026-06-09days on market $102,500 Active 66 DOM
-
2026-06-08days on market $102,500 Active 65 DOM
-
2026-06-07days on market $102,500 Active 64 DOM
-
2026-06-04days on market $102,500 Active 61 DOM
-
2026-06-03days on market $102,500 Active 60 DOM
-
2026-06-02days on market $102,500 Active 59 DOM
-
2026-06-02remarks 687-char remark
-
2026-06-02price $102,500 Active 58 DOM
-
2026-06-01days on market $110,000 Active 58 DOM
-
2026-05-31days on market $110,000 Active 57 DOM
-
2026-04-04$110,000 Active 703-char remark
-
2026-04-04historical
-
2026-03-13price $110,000
-
2026-02-16price $115,000
-
2026-01-17$120,000 Active
-
2003-07-09soldstatus
-
2003-03-31historical
-
2003-02-20$67,100
-
2003-02-11historical
-
2003-01-03$67,100
-
2002-12-31historical
-
2002-07-17$67,100
-
2000-08-16soldstatus
ⓘ Source: listings_history table (triggers on properties + properties_extension) + one-shot
backfill from property_details.listing_events for pre-trigger history.
Tax reassessment forecast TX · Resets to sale price
- Current annual tax
- $2,148 · $179/mo
- Projected year-2 tax
- $2,148 · $179/mo
- Expected delta
- $0/yr ($0/mo · 0.0%)
ⓘ Screening estimate from a state-policy table — verify with the county assessor before closing.
Climate risk First Street
- Flood 4/10 Moderate FEMA zone X (unshaded) · 22% chance over 30 yrs
- Wildfire 1/10 Low
- Heat 9/10 Extreme 7 d/yr ≥110°F today · 23 d/yr by 30 yrs out
- Wind 9/10 Extreme 99% chance of damaging wind over 30 yrs
- Air quality 2/10 Low 2 unhealthy d/yr today · 2 by 30 yrs out
Nearby sold comps map
Loading sold comps map…
Walkable amenities ~0.75 mi
Loading nearby amenities…
Taxation est. · year 1
- Rental income
- $14,205
- − Mortgage interest
- −$5,742
- − Property taxes
- −$2,148
- − Insurance
- −$512
- − Repairs & maintenance
- −$1,136
- − Management
- −$1,136
- − HOA
- −$3,132
- − Depreciation
- −$2,982
- Taxable loss
- −$2,584
- Est. tax savings @ 24.0%
- +$620
- After-tax cash flow
- $-401/yr
For passive investors: Depreciation is non-cash, so a rental often shows a tax loss while cash-flowing — sheltering income. Rental losses are passive: they offset passive income freely, and up to $25,000/yr can offset ordinary (W-2) income if you actively participate and your MAGI is under $100k (phasing out to $0 by $150k); unused losses carry forward. On sale, claimed depreciation is recaptured at up to 25%, and gains may owe capital-gains tax (a 1031 exchange can defer both). Figures are a year-1 estimate at your 24.0% rate — not tax advice; consult a CPA.
Schools (NCES district)
- District
- Alief ISD
- NCES district ID
- 4807830
- Math proficiency
- 23% ▼ -19.00%
- Reading proficiency
- 28% ▼ -8.00%
- Median HH income
- $37,775
- Composite
- 21.29/100
- National rank
- #8391
- State rank
- #717 of 826 in TX
Livability — Houston
- Score
- 74/100
- State rank
- #184
- US rank
- #4771
Category grades
Schools grade is shown separately in the Schools card above.
Census & demographics
- Census place
- Houston, TX
- County
- Harris County · 4,702,590 people
- City population
- 3,226,434
- Metro
- Houston-The Woodlands-Sugar Land, TX
- Population (ZIP)
- 38,721
- Household income
- $59,097
- Rent vs Own
- Severe rent burden
- 3994.0
Population outlook (Harris County) Hauer SSP2
- Today (2025)
- 5,571,493 people
- By 2030
- 6,089,821 · +9.3%
- By 2040
- 7,142,806 · +28.2%
- By 2050
- 8,185,864 · +46.9%
- By 2075
- 10,574,329 · +89.8%
- By 2100
- 12,109,958 · +117.4%
Race, ethnicity, and origin ACS 2023
- Neighborhood character
- Highly diverse neighborhood (Simpson 0.72)
- Race & ethnicity
- Hispanic / Latino 36% White 31% Black 24% Two or more races 18% Asian 6% Native American 1%
- Hispanic origin (detail)
- Mexican 14% Cuban 4%
- Common ancestry
- Romanian 1% Serbian 1% Italian 1%
- Foreign-born
- 35% · Canada, Jamaica, China
- Languages at home
- 55% English-only · Spanish 31% Other Indo-European 2% Russian/Polish/Slavic 2%
Political lean MEDSL · Harris
- 2024 margin
- Lean D (+5.5) · D 52.0% · R 46.4% · Other 1.6%
- 2008→2024 swing
- +3.9pp toward D · 2008: 1.6pp · 2024: 5.5pp
- All cycles
- 2024: D+5.5 2020: D+13.3 2016: D+12.4 2012: D+0.1 2008: D+1.6
Not yet ingested
- Civics
- —
Market trends
- HPI YoY
- ▼ -234.36%
- Current HPI
- 215.9671
- Rent YoY
- ▼ -2.30%
- Metro
- Houston-The Woodlands-Sugar Land, TX
- State GDP YoY
- ▲ 3.95%
- F500 in state
- 110
Industry mix (Fortune 500 HQ in TX)
| Industry | F500 HQs | Revenue |
|---|---|---|
| Energy | 16 | $1,198B |
|
||
| Technology | 5 | $198B |
|
||
| Engineering / Construction | 4 | $72B |
|
||
| Energy Services | 3 | $60B |
|
||
| Utilities | 3 | $41B |
|
||
| Healthcare | 2 | $330B |
|
||
Price history
+52.8% since first listed16 events — show timeline
- 2026-06-10 Listing Removed — HARMLS
- 2026-06-10 Listed $102,500 HARMLS
- 2026-06-01 Price Changed $102,500 HARMLS
- 2026-04-04 Listing Removed — HARMLS
- 2026-04-04 Listed $110,000 HARMLS
- 2026-03-13 Price Changed $110,000 HARMLS
- 2026-02-16 Price Changed $115,000 HARMLS
- 2026-01-17 Listed $120,000 HARMLS
- 2003-07-09 Sold (Public Records) — Public Records
- 2003-03-31 Listing Removed — HARMLS
- 2003-02-20 Listed $67,100 HARMLS
- 2003-02-11 Listing Removed — HARMLS
- 2003-01-03 Listed $67,100 HARMLS
- 2002-12-31 Listing Removed — HARMLS
- 2002-07-17 Listed $67,100 HARMLS
- 2000-08-16 Sold (Public Records) — Public Records
Property tax history
+0.7%/yrLatest (2025): $2,148 · -9.9% YoY. Source: county tax records.
Cash-flow waterfall
monthlySold comps — $/sqft
last 12 mo · ≤1 miLoading sold comps…