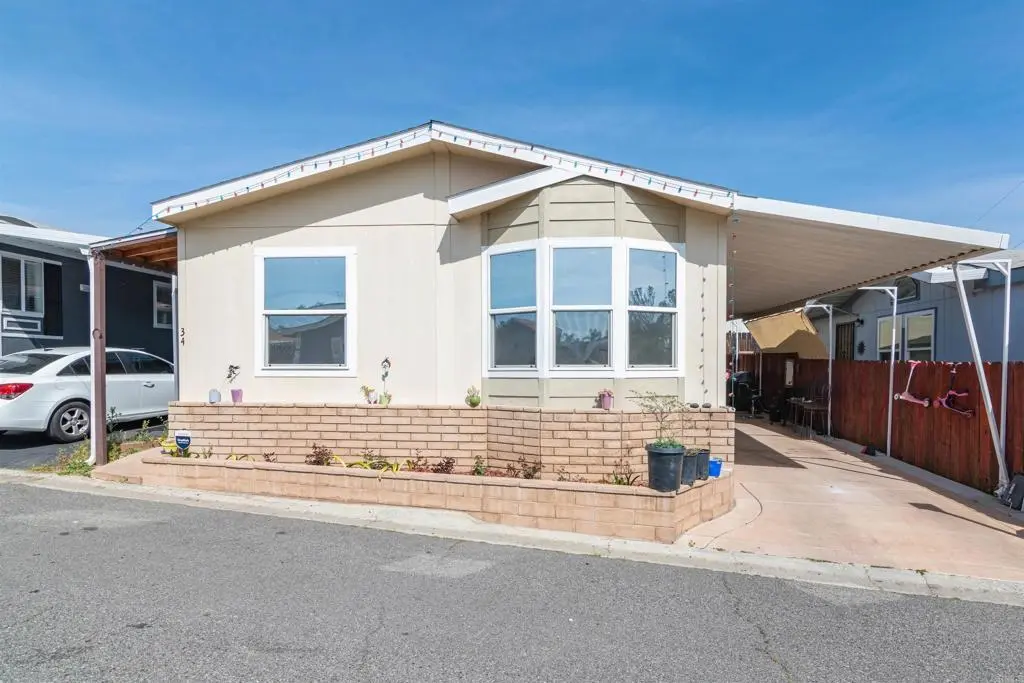
1638 Calavo Rd #34
Fallbrook, CA 92028
$325,000C
3 bd · 2.0 ba ·
1,120 sqft ·
Built 2013
· Manufactured
· Active
· 94 DOM
Cashflow @ list (25.0% down · 7.5%)
Estimated rent
$3,227/mo
Mortgage (P&I)
−$1,704
Tax + insurance
−$211
HOA
−$0
Vac / Maint / Mgmt
−$678
Net cashflow
$634/mo
Annual
$7,611/yr
Cap rate
8.63%
Cash-on-cash
8.36%
DSCR
1.37
1% rule
0.99%
Cash to close
$91,000
Investor read
- This is a 3-bed/2.0-bath manufactured listed at $325k.
- At list price, monthly cash flow is $634 ($8k/yr) — positive.
- The deal already cash-flows at list — no discount required.
- To meet the 1% rule (rent ≥ 1% of price), the offer needs to be $323k (0.7% below list).
- It's been on market 94 days — a 9% lower offer ($296k) is reasonable based on typical stale-listing flexibility.
- Recommended offer: $296k (9.0% below list) — sets the bar for market timing.
- Local home prices are declining (-3.0%/yr); year-one equity from $2k of loan paydown is wiped out by about $10k of value loss. Plan a longer hold.
- Location reads 42/100 on livability (#1,364 in CA) — a working-class tenant base; expect higher turnover. Watch: crime D-, amenities F, commute F.
- Fallbrook Union High (suburban): math 32% / reading 58% proficiency, ranked #183 of 517 in CA (top 35%) — families likely to look elsewhere, expect single-tenant / working-renter base with shorter leases.
- Zoned schools: Live Oak Elementary (math 24% / reading 24%, grade F, #973 of 1,571 statewide, top 73%, 644 students, 73% FRL); James E. Potter Intermediate (729 students, 84% FRL); Fallbrook High (math 35% / reading 59%, grade D-, #389 of 1,170 statewide, top 35%, 1,924 students, 71% FRL).
- Market conditions: Rents soft (-0.3%/yr); 345 active listings in the ZIP; 2 comparable units currently listed for rent nearby; high-income renter base; 11,759 units permitted in San Diego County in 2024 (7,244 in 5+ unit buildings).
- San Diego County population projected at +20% by 2050 — long-run rental-demand tailwind backs the buy-and-hold thesis.
- Climate carrying-cost: major wildfire risk; extreme-heat days projected 7→22/yr by 2055 (HVAC capex compounding) — expect insurance premiums to compound above CPI over the hold.
- Cap rate 8.6% vs local median 2.3% in Fallbrook — top-decile yield for the area; either an underpriced asset or a hidden risk that comps aren't pricing in. Stress-test before assuming the spread holds.
- This rent runs 35% of the median local income ($111k/yr) — at the standard rent-burdened threshold; future hikes will face affordability resistance.
Questions for listing agent
- It's been on market 94 days. Have you received any prior offers? Is the seller open to a 9% concession, seller financing, or rate buy-down credit?
- Why hasn't it sold? Are there any deal-killer items the seller is aware of (foundation, flood, title, zoning, code violations)?
- Is there a deadline driving the sale (1031 exchange, divorce, estate, relocation)? That informs how much negotiation room exists.
- Schools are D-rated, which usually means shorter tenancies and higher turnover. Who's the typical renter profile here, and what's been the actual vacancy rate?
- Crime grade is D in this area — have there been break-ins, vandalism, or insurance claims at this property in the last 3 years? What carrier currently insures it and at what premium?
- What's the average days-on-market for RENTAL listings here right now (not sales)? A rising rental-DOM trend means longer vacancies and softer asking-rent achievability than the comps imply.
- What's the recent tenant-quality profile in this submarket — average credit score on applications, eviction rate, late-payment / NSF rate, and stable-employment percentage? A property-management company in the area should have these aggregated.
- How much new for-sale + rental construction is in the pipeline within 1–3 miles? Heavy new supply typically softens prices + rents 12–24 months out; constrained supply supports both.
CashFlowRE · CFR-22BN5GAJ1B4BRN
· Data 21 h ago
cashflowre.app · 2026-05-29