66 Brees Blvd #66
San Antonio, TX 78209
$99,500D
1 bd · 1.0 ba ·
445 sqft ·
Built 1965
· Condo
· Active
· 12 DOM
Cashflow @ list (25.0% down · 7.5%)
Estimated rent
$1,080/mo
Mortgage (P&I)
−$522
Tax + insurance
−$166
HOA
−$222
Vac / Maint / Mgmt
−$227
Net cashflow
$-56/mo
Annual
$-677/yr
Cap rate
5.61%
Cash-on-cash
-2.43%
DSCR
0.89
1% rule
1.09%
Cash to close
$27,860
Investor read
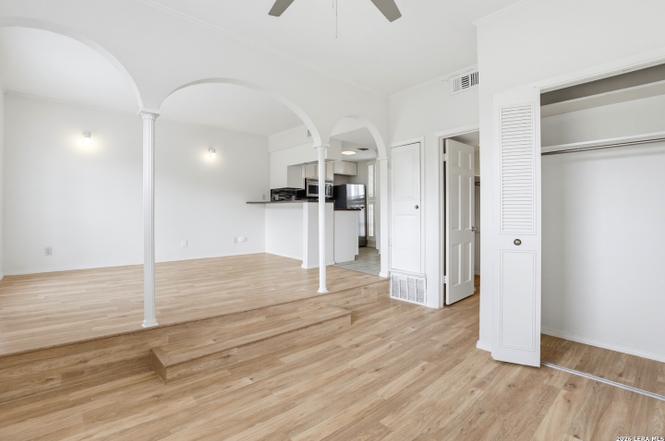
- This is a 1-bed/1.0-bath condo listed at $100k. Condition is rated good.
- At list price, monthly cash flow is $-56 ($-677/yr) — negative.
- To cash-flow at today's rent, offer at most $91k (8.2% below list).
- Meets the 1% rule at list price ($1k rent vs $100k).
- Only 12 days on market — expect competitive offers; lowballing is unlikely to land.
- Recommended offer: $91k (8.2% below list) — sets the bar for cash-flow.
- Local home prices are declining (-3.0%/yr); year-one equity from $688 of loan paydown is wiped out by about $3k of value loss. Plan a longer hold.
- Location reads 80/100 on livability (#31 in TX, #1,616 nationally) — a professional / high-income tenant draw. Strengths: amenities A+, commute A+, cost of living A+; Watch: crime F.
- Alamo Heights ISD (urban): math 52% / reading 60% proficiency, ranked #73 of 826 in TX (top 9%) — acceptable for families but not a draw, mixed tenant base, ~2y average lease.
- Zoned schools: Woodridge El (math 51% / reading 64%, grade C+, #492 of 4,322 statewide, top 12%, 878 students, 19% FRL); Alamo Heights J H (math 54% / reading 57%, grade B-, #240 of 1,662 statewide, top 15%, 1,090 students, 24% FRL); Alamo Heights H S (math 60% / reading 71%, grade B, #193 of 1,632 statewide, top 12%, 1,606 students, 17% FRL) — zoned schools at 20% FRL track the district average.
- Watch-outs: HOA is 21% of rent.
- Market conditions: Rents soft (-1.0%/yr); 373 active listings in the ZIP; solid renter incomes; 8,308 units permitted in Bexar County in 2024 (2,506 in 5+ unit buildings).
- Bexar County population projected at +50% by 2050 — long-run rental-demand tailwind backs the buy-and-hold thesis.
- Climate carrying-cost: severe wind risk, 80% chance of damaging wind over 30y; extreme-heat days projected 7→22/yr by 2055 (HVAC capex compounding) — expect insurance premiums to compound above CPI over the hold.
- Cap rate 5.6% vs local median 3.8% in San Antonio — top-decile yield for the area; either an underpriced asset or a hidden risk that comps aren't pricing in. Stress-test before assuming the spread holds.
- This rent is only 15% of the median local income ($87k/yr) — well below the 30% rent-burden line; pricing power to push rent on renewal without tenant pushback.
Questions for listing agent
- What do current leases actually rent for vs. the listed asking? Can we see a recent rent roll and the last 12 months of T-12 income?
- Built in 1965 — when were the roof, HVAC, electrical panel, plumbing, and water heater last replaced?
- What does the HOA fee cover, when was the last increase, and are there any pending special assessments or reserve-fund shortfalls?
- Any open or pending special assessments — roof, HVAC, plumbing, elevator, façade? What's the per-unit balance and payoff schedule, and is the seller paying it off at close or rolling it to the buyer?
- Is there a deadline driving the sale (1031 exchange, divorce, estate, relocation)? That informs how much negotiation room exists.
- Crime grade is F in this area — have there been break-ins, vandalism, or insurance claims at this property in the last 3 years? What carrier currently insures it and at what premium?
- The area grade is low — what's the realistic commute time and amenity access for the typical tenant pool here? Any planned neighborhood developments (good or bad) we should know about?
- What's the average days-on-market for RENTAL listings here right now (not sales)? A rising rental-DOM trend means longer vacancies and softer asking-rent achievability than the comps imply.
CashFlowRE · CFR-22KR17443RJ0Q5
· Data 1 day ago
cashflowre.app · 2026-05-29