66 Brees Blvd #66 · San Antonio, TX
Flood risk 1/10 · Minimal
- FEMA flood zone
- X (unshaded)
- Chance of flooding over 30 yrs
- 0.0%
- Est. flood insurance / yr
- $507 – $1,088
Fire risk 1/10 · Minimal
- Est. fire insurance / yr
- $1,222 – $2,270
Heat risk 8/10 · Major
- Hot days now (above 108°F)
- 7 days/yr
- Hot days in 30 yrs
- 22 days/yr
Wind risk 8/10 · Major
- Chance of severe wind over 30 yrs
- 80.0%
Air-quality risk 2/10 · Minimal
- Unhealthy air days now
- 1 days/yr
- Unhealthy air days in 30 yrs
- 1 days/yr
Risk factors via First Street. Map © Google.
Why this score? — see what drove the D grade
The composite is a weighted blend of 9 inputs, each scored 0–100. Each bar is that input's sub-score; the figure is the points it added to the 100-point composite (weight × sub-score).
- Cash flow +10.2/30.0
- ARV discount +7.5/15.0
- 1% rule +5.9/10.0
- Schools +5.0/10.0
- Livability +4.0/5.0
- Condition / age +4.0/5.0
- DSCR +2.9/10.0
- Rent growth +2.2/5.0
- Appreciation +0.0/10.0
$99,500
🖨 Deal sheet (PDF) 📄 Offer letter ✓ Due diligence
Listing remarks
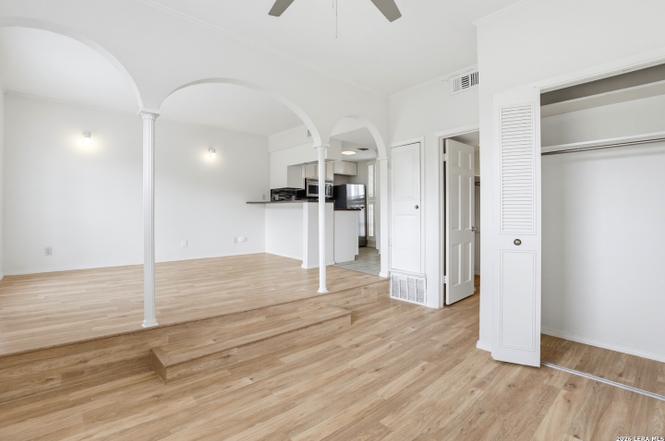
Studio condo tucked away in desirable Alamo Heights area. Location to convenient shopping, dining, parks and much more. Large shade trees, tile roofs and common areas including a newly resurfaced pool lend an old world appeal to these condos. Unit has French doors with balcony. Bath has recent remodel with updated tile. One walk-in closet plus closet. Unit has one assigned covered parking area.
Key facts
- Alamo heights area
- Updated tile
- Recent remodel
Tags
Property features AI
Finance
- Other: Managed on-site and off-site; Subdivision: Barcelona (Barcelona Condo)
- Financial info: Monthly HOA fee $222.94; Association transfer fee $250
- HOA & community: Mandatory HOA; HOA pays limited insurance, condo management, common area liability, common maintenance, trash removal, and pest control; Monthly HOA fee
Exterior
- Parking: Detached parking
- Security: On-site and off-site management
- Utilities: Trash removal included in HOA; Pest control included in HOA
- Home design: Condo unit in a multi-unit building; One level unit; Pre-owned; Tile roof
- Construction: Approximately 61 years old
- Exterior features: Stucco exterior; Deck/balcony; BBQ pit/grill; Pool (community); BBQ/Picnic area (community)
Interior
- Kitchen: Stove/Range; Microwave; Refrigerator
- Bedrooms: Master bedroom approximately 12 x 10 (entry level 2)
- Flooring: Ceramic tile; Laminate
- Bathrooms: 1 full bathroom
- Heating & cooling: Central heating (natural gas); Central air conditioning
- Interior features: Ceiling fans; Chandelier; All window coverings remain; 1 living area; Recent rehab
- Laundry & utility: Washer and dryer included
Neighborhood map
What this means for you Summary
Snapshot
- This is a 1-bed/1.0-bath condo listed at $100k. Condition is rated good.
Deal economics
- At list price, monthly cash flow is $-56 ($-677/yr) — negative.
- To cash-flow at today's rent, offer at most $91k (8.2% below list).
- Meets the 1% rule at list price ($1k rent vs $100k).
- Recommended offer: $91k (8.2% below list) — sets the bar for cash-flow.
- Cap rate 5.6% vs local median 3.8% in San Antonio — top-decile yield for the area; either an underpriced asset or a hidden risk that comps aren't pricing in. Stress-test before assuming the spread holds.
Location & tenants
- Location reads 80/100 on livability (#31 in TX, #1,616 nationally) — a professional / high-income tenant draw. Strengths: amenities A+, commute A+, cost of living A+; Watch: crime F.
- Alamo Heights ISD (urban): math 52% / reading 60% proficiency, ranked #73 of 826 in TX (top 9%) — acceptable for families but not a draw, mixed tenant base, ~2y average lease.
- Zoned schools: Woodridge El (math 51% / reading 64%, grade C+, #492 of 4,322 statewide, top 12%, 878 students, 19% FRL); Alamo Heights J H (math 54% / reading 57%, grade B-, #240 of 1,662 statewide, top 15%, 1,090 students, 24% FRL); Alamo Heights H S (math 60% / reading 71%, grade B, #193 of 1,632 statewide, top 12%, 1,606 students, 17% FRL) — zoned schools at 20% FRL track the district average.
- Market conditions: Rents soft (-1.0%/yr); 373 active listings in the ZIP; solid renter incomes; 8,308 units permitted in Bexar County in 2024 (2,506 in 5+ unit buildings).
- This rent is only 15% of the median local income ($87k/yr) — well below the 30% rent-burden line; pricing power to push rent on renewal without tenant pushback.
Forward outlook
- Local home prices are declining (-3.0%/yr); year-one equity from $688 of loan paydown is wiped out by about $3k of value loss. Plan a longer hold.
- Bexar County population projected at +50% by 2050 — long-run rental-demand tailwind backs the buy-and-hold thesis.
Negotiation context
- Only 12 days on market — expect competitive offers; lowballing is unlikely to land.
Risks & watch-outs
- Watch-outs: HOA is 21% of rent.
- Climate carrying-cost: severe wind risk, 80% chance of damaging wind over 30y; extreme-heat days projected 7→22/yr by 2055 (HVAC capex compounding) — expect insurance premiums to compound above CPI over the hold.
Questions for the listing agent
- What do current leases actually rent for vs. the listed asking? Can we see a recent rent roll and the last 12 months of T-12 income?
- Built in 1965 — when were the roof, HVAC, electrical panel, plumbing, and water heater last replaced?
- What does the HOA fee cover, when was the last increase, and are there any pending special assessments or reserve-fund shortfalls?
- Any open or pending special assessments — roof, HVAC, plumbing, elevator, façade? What's the per-unit balance and payoff schedule, and is the seller paying it off at close or rolling it to the buyer?
- Is there a deadline driving the sale (1031 exchange, divorce, estate, relocation)? That informs how much negotiation room exists.
- Crime grade is F in this area — have there been break-ins, vandalism, or insurance claims at this property in the last 3 years? What carrier currently insures it and at what premium?
- The area grade is low — what's the realistic commute time and amenity access for the typical tenant pool here? Any planned neighborhood developments (good or bad) we should know about?
- What's the average days-on-market for RENTAL listings here right now (not sales)? A rising rental-DOM trend means longer vacancies and softer asking-rent achievability than the comps imply.
- What's the recent tenant-quality profile in this submarket — average credit score on applications, eviction rate, late-payment / NSF rate, and stable-employment percentage? A property-management company in the area should have these aggregated.
- How much new apartment / multifamily construction is in the pipeline within 1–3 miles? Heavy new supply (>2% of stock underway) typically softens rents 12–24 months out; light construction supports rent growth.
Investment metrics
- 1% rule
- 1.09% ✓
- Cap rate
- 5.61%
- Cash-on-cash
- -2.43%
- DSCR
- 0.89
- GRM
- 7.7
CMA / ARV
No comps found within radius.
Projected returns pro-forma
-3.0% appreciation · 0.0% rent growth · sell at horizon
- IRR
- -24.8%
- Equity multiple
- 0.18×
- Total profit
- $-22,727
- Equity at exit
- $14,836
- IRR
- -40.3%
- Equity multiple
- -0.29×
- Total profit
- $-36,027
- Equity at exit
- $8,603
Cash invested: $27,860 (down + closing). Projections, not guarantees.
Landlord ↔ Tenant lean methodology
- Overall (STATE)
- 87 Strongly Landlord-Friendly
- State Texas
- 87 Strongly Landlord-Friendly · R+5
- County
- — inherits STATE
- City
- — inherits STATE
ZIP-level market 78209
- Rents YoY
- -1.0%
- Active inventory
- 373
- Price-to-rent
- 7.7×
Monthly cashflow live
- Estimated rent
- $1,080 medium interval (Pro) →
- Mortgage (P&I)
- −$522
- Tax est. 1.5%
- −$124 /mo · $1,492/yr
- Insurance
- −$41
- HOA
- −$222
- Vacancy / Maint / Mgmt
- −$227
- Net cashflow
- $-56
Break-even live
Sensitivity live
| Price | -10% $12 | -5% $-22 | +0% $-56 | +5% $-91 | +10% $-125 |
|---|---|---|---|---|---|
| Rent | -10% $-142 | -5% $-99 | +0% $-56 | +5% $-14 | +10% $29 |
| Rate | -1.0pp $-6 | -0.5pp $-31 | base $-56 | +0.5pp $-82 | +1.0pp $-108 |
UW: 25.0% down · 7.5% · 30yr · 1.5% tax · 5.0% vac · 8.0% maint · 8.0% mgmt
Financing live
Cash to close
- Down payment
- $24,875
- Closing costs
- $2,985
- Reserves months
- —
- Total cash needed
- —
Loan-product check · same deal, 3 products live
Conventional
25% down · 7.5% · 30yr
- Down + closing
- —
- Monthly P&I
- —
- Monthly cashflow
- —
- DSCR
- —
- Eligible?
- —
Personal DTI + credit; lowest rate.
DSCR
20% down · 8.5% · 30yr
- Down + closing
- —
- Monthly P&I
- —
- Monthly cashflow
- —
- DSCR
- —
- Eligible?
- —
No personal income docs; deal must DSCR.
Hard money
10% down · 12.0% · 12mo
- Down + closing
- —
- Monthly P&I
- —
- Monthly cashflow
- —
- DSCR
- —
- Eligible?
- —
Short-term bridge; refi at stabilization.
HOA detail condo
- Monthly dues
- $222 · $2,664/yr
- Likely covers
- pool
- Assessments
- None detected in remarks — confirm with the listing agent.
Listing history 8 events
-
2026-06-21statusdays on market $99,500 Active 12 DOM
-
2026-06-18days on market $99,500 New 9 DOM
-
2026-06-17days on market $99,500 New 8 DOM
-
2026-06-16days on market $99,500 New 7 DOM
-
2026-06-15days on market $99,500 New 6 DOM
-
2026-06-13days on market $99,500 New 4 DOM
-
2026-06-10remarks 398-char remark
-
2026-06-10$99,500 New 1 DOM
ⓘ Source: listings_history table (triggers on properties + properties_extension) + one-shot
backfill from property_details.listing_events for pre-trigger history.
Climate risk First Street
- Flood 1/10 Low FEMA zone X (unshaded) · 0% chance over 30 yrs
- Wildfire 1/10 Low
- Heat 8/10 Severe 7 d/yr ≥108°F today · 22 d/yr by 30 yrs out
- Wind 8/10 Severe 80% chance of damaging wind over 30 yrs
- Air quality 2/10 Low 1 unhealthy d/yr today · 1 by 30 yrs out
Nearby sold comps map
Loading sold comps map…
Walkable amenities ~0.75 mi
Loading nearby amenities…
Taxation est. · year 1
- Rental income
- $12,960
- − Mortgage interest
- −$5,574
- − Property taxes
- −$1,492
- − Insurance
- −$498
- − Repairs & maintenance
- −$1,037
- − Management
- −$1,037
- − HOA
- −$2,664
- − Depreciation
- −$2,895
- Taxable loss
- −$2,235
- Est. tax savings @ 24.0%
- +$536
- After-tax cash flow
- $-140/yr
For passive investors: Depreciation is non-cash, so a rental often shows a tax loss while cash-flowing — sheltering income. Rental losses are passive: they offset passive income freely, and up to $25,000/yr can offset ordinary (W-2) income if you actively participate and your MAGI is under $100k (phasing out to $0 by $150k); unused losses carry forward. On sale, claimed depreciation is recaptured at up to 25%, and gains may owe capital-gains tax (a 1031 exchange can defer both). Figures are a year-1 estimate at your 24.0% rate — not tax advice; consult a CPA.
Condition & rehab AI · 12 photos
This studio condo in Alamo Heights is in good condition with recent updates, making it move-in ready and suitable for both resale and rental.
Value-add opportunities
- Both Painting exterior — Enhances curb appeal and value
- Both Landscaping common areas — Improves curb appeal and enhances community feel
- Resale Upgrade kitchen appliances — Modernizes the space and appeals to buyers
- Both Install smart home features — Enhances convenience and marketability
Renovation cost estimate screening
Value-add ROI direction
- Both Painting exterior — Enhances curb appeal and value ↑
- Both Landscaping common areas — Improves curb appeal and enhances community feel ↑
- Resale Upgrade kitchen appliances — Modernizes the space and appeals to buyers ↑
- Both Install smart home features — Enhances convenience and marketability ↑
ⓘ Cost ranges are severity-bucket heuristics (US national rule-of-thumb). Get contractor quotes + a written scope before underwriting a rehab budget.
Schools (NCES district)
- District
- Alamo Heights ISD
- NCES district ID
- 4807590
- Math proficiency
- 52% ▼ -9.00%
- Reading proficiency
- 60% ▼ -3.00%
- Median HH income
- $78,337
- Composite
- 50.44/100
- National rank
- #1865
- State rank
- #73 of 826 in TX
Livability — San Antonio
- Score
- 80/100
- State rank
- #31
- US rank
- #1616
Category grades
Schools grade is shown separately in the Schools card above.
Census & demographics
- Census place
- San Antonio, TX
- County
- Bexar County · 1,990,555 people
- City population
- 1,806,925
- Metro
- San Antonio-New Braunfels, TX
- Population (ZIP)
- 43,400
- Household income
- $86,514
- Rent vs Own
- Severe rent burden
- 1480.0
Population outlook (Bexar County) Hauer SSP2
- Today (2025)
- 2,336,851 people
- By 2030
- 2,560,728 · +9.6%
- By 2040
- 3,020,569 · +29.3%
- By 2050
- 3,493,522 · +49.5%
- By 2075
- 4,668,459 · +99.8%
- By 2100
- 5,533,242 · +136.8%
Race, ethnicity, and origin ACS 2023
- Neighborhood character
- Diverse neighborhood (Simpson 0.56)
- Race & ethnicity
- White 59% Hispanic / Latino 30% Two or more races 19% Black 4% Asian 3%
- Hispanic origin (detail)
- Mexican 25%
- Common ancestry
- Slovak 3% Lithuanian 2% Romanian 2%
- Foreign-born
- 9% · Canada, South Korea
- Languages at home
- 79% English-only · Spanish 17% Other Indo-European 2% Tagalog/Filipino 0%
Political lean MEDSL · Bexar
- 2024 margin
- Lean D (+9.8) · D 54.3% · R 44.6% · Other 1.1%
- 2008→2024 swing
- +4.2pp toward D · 2008: 5.6pp · 2024: 9.8pp
- All cycles
- 2024: D+9.8 2020: D+18.2 2016: D+13.5 2012: D+4.6 2008: D+5.6
Not yet ingested
- Civics
- —
Market trends
- HPI YoY
- ▼ -386.19%
- Current HPI
- 251.5759
- Rent YoY
- ▼ -1.04%
- Metro
- San Antonio-New Braunfels, TX
- State GDP YoY
- ▲ 3.95%
- F500 in state
- 110
Industry mix (Fortune 500 HQ in TX)
| Industry | F500 HQs | Revenue |
|---|---|---|
| Energy | 16 | $1,198B |
|
||
| Technology | 5 | $198B |
|
||
| Engineering / Construction | 4 | $72B |
|
||
| Energy Services | 3 | $60B |
|
||
| Utilities | 3 | $41B |
|
||
| Healthcare | 2 | $330B |
|
||
Price history
1 event — show timeline
- 2026-06-09 Listed $99,500 LERA
Cash-flow waterfall
monthlySold comps — $/sqft
last 12 mo · ≤1 miLoading sold comps…