1 Wild Ridge/ Sawgrass
Black Jack, MO 63033
$334,900D-
4 bd · 2.5 ba ·
2,491 sqft ·
Built —
· SingleFamily
· Active
· 1490 DOM
Cashflow @ list (25.0% down · 7.5%)
Estimated rent
$2,161/mo
Mortgage (P&I)
−$1,909
Tax + insurance
−$607
HOA
−$13
Vac / Maint / Mgmt
−$454
Net cashflow
$-821/mo
Annual
$-9,856/yr
Cap rate
3.59%
Cash-on-cash
-9.67%
DSCR
0.57
1% rule
0.59%
Cash to close
$101,917
Investor read
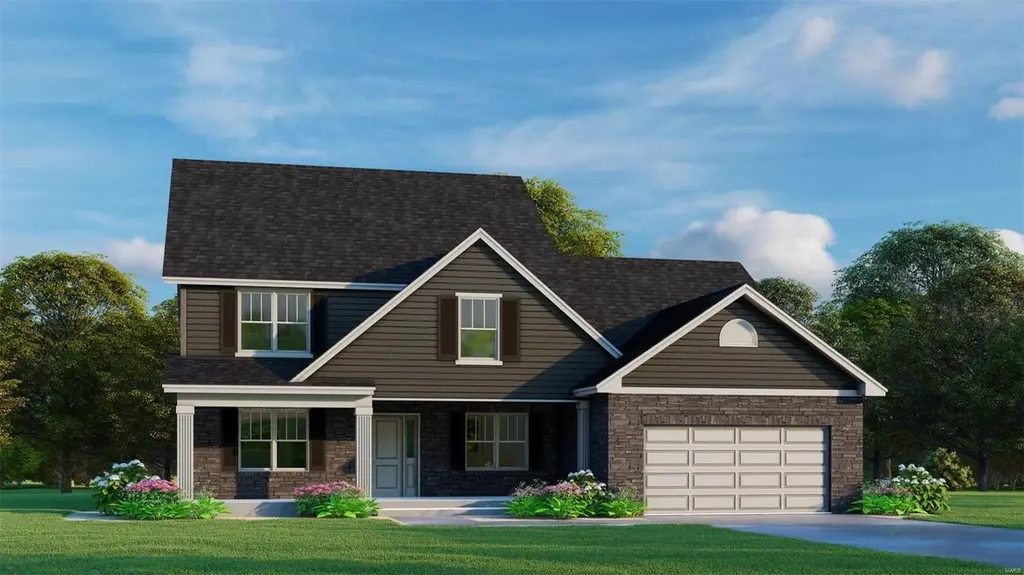
- This is a 4-bed/2.5-bath single-family listed at $335k.
- At list price, monthly cash flow is $-821 ($-10k/yr) — negative.
- To cash-flow at today's rent, offer at most $245k (26.8% below list).
- To meet the 1% rule (rent ≥ 1% of price), the offer needs to be $216k (35.5% below list).
- It's been on market 1490 days — a 12% lower offer ($295k) is reasonable based on typical stale-listing flexibility.
- Recommended offer: $216k (35.5% below list) — sets the bar for 1% rule.
- In year one you build about $39k of equity ($3k loan paydown + $36k appreciation (10.0% local appreciation)).
- Location reads 70/100 on livability (#132 in MO) — a middle-class / working-renter tenant base. Strengths: cost of living A+, housing A+; Watch: health & safety C-, crime D+, amenities F.
- Hazelwood (suburban): math 11% / reading 26% proficiency, ranked #306 of 324 in MO (top 94%) — low school quality limits family demand, transient renter base, plan for 1-2y turnover.
- Zoned schools: Jury Elem. (math 5% / reading 19%, grade F, #1,016 of 1,115 statewide, top 92%, 420 students, 99% FRL); Hazelwood Central High (math 12% / reading 33%, grade F, #455 of 521 statewide, top 88%, 1,628 students, 52% FRL) — zoned schools average 75% FRL vs 53% district-wide (22 pts higher); higher-poverty schools than district average — tighter screening recommended.
- Market conditions: Rents rising fast (+7.5%/yr); 218 active listings in the ZIP; 5 comparable units currently listed for rent nearby; rentals leasing fast (median 11d on market — plan ~1-2 weeks tenant-placement turnaround); 920 units permitted in St. Louis County in 2024 (250 in 5+ unit buildings).
- By year 2, paydown + projected appreciation supports a ~$63k cash-out refi (75% LTV) — recoverable capital for the next deal without selling this one.
- Cap rate 3.6% vs local median 6.2% in Black Jack — below-typical yield; the buyer is paying a premium for something (appreciation thesis, condition, location) that the cap rate doesn't capture.
- This rent runs 39% of the median local income ($67k/yr) — at the standard rent-burdened threshold; future hikes will face affordability resistance.
Questions for listing agent
- What do current leases actually rent for vs. the listed asking? Can we see a recent rent roll and the last 12 months of T-12 income?
- It's been on market 1490 days. Have you received any prior offers? Is the seller open to a 35% concession, seller financing, or rate buy-down credit?
- What does the HOA fee cover, when was the last increase, and are there any pending special assessments or reserve-fund shortfalls?
- Why hasn't it sold? Are there any deal-killer items the seller is aware of (foundation, flood, title, zoning, code violations)?
- Is there a deadline driving the sale (1031 exchange, divorce, estate, relocation)? That informs how much negotiation room exists.
- Crime grade is D in this area — have there been break-ins, vandalism, or insurance claims at this property in the last 3 years? What carrier currently insures it and at what premium?
- The area grade is low — what's the realistic commute time and amenity access for the typical tenant pool here? Any planned neighborhood developments (good or bad) we should know about?
- What's the average days-on-market for RENTAL listings here right now (not sales)? A rising rental-DOM trend means longer vacancies and softer asking-rent achievability than the comps imply.
CashFlowRE · CFR-22VVR41T73CFDS
· Data 2 days ago
cashflowre.app · 2026-05-29