 🏗️ New Construction
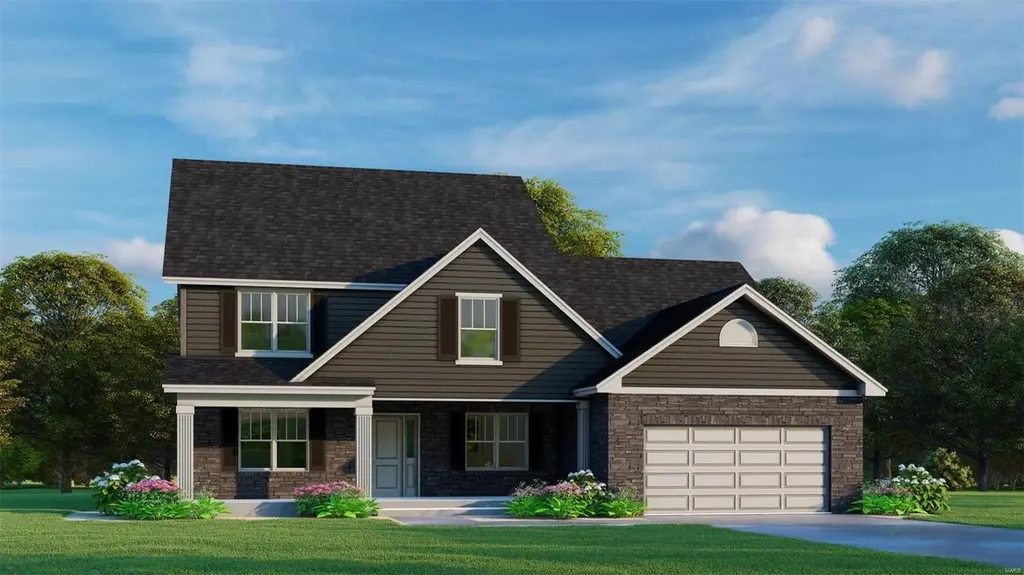
1 Wild Ridge/ Sawgrass · Black Jack, MO
Flood risk 1/10 · Minimal
- FEMA flood zone
- X (unshaded)
- Chance of flooding over 30 yrs
- 0.0%
- Est. flood insurance / yr
- $507 – $1,088
Fire risk 1/10 · Minimal
- Est. fire insurance / yr
- $1,054 – $1,958
Heat risk 4/10 · Minor
- Hot days now (above 106°F)
- 7 days/yr
- Hot days in 30 yrs
- 21 days/yr
Wind risk 2/10 · Minimal
- Chance of severe wind over 30 yrs
- 1.0%
Air-quality risk 3/10 · Minor
- Unhealthy air days now
- 3 days/yr
- Unhealthy air days in 30 yrs
- 5 days/yr
Risk factors via First Street. Map © Google.
Why this score? — see what drove the D- grade
The composite is a weighted blend of 9 inputs, each scored 0–100. Each bar is that input's sub-score; the figure is the points it added to the 100-point composite (weight × sub-score).
- Appreciation +10.0/10.0
- ARV discount +7.5/15.0
- Cash flow +5.2/30.0
- Rent growth +4.4/5.0
- Livability +3.5/5.0
- Condition / age +2.5/5.0
- Schools +1.7/10.0
- 1% rule +0.9/10.0
- DSCR +0.0/10.0
$334,900
🖨 Deal sheet 📄 Offer letter ✓ Due diligence
Listing remarks
Now Open! To Be Built Home ready to personalize into your dream home! BASE PRICE & PHOTOS are for 4BR, 2.5BA Sawgrass 1 ½ Story. Pricing will vary depending on various interior/exterior selections. Highlight of this floor plan is the two story great rm, w/ available window wall or fireplace. Luxurious kitchen, breakfast area, corner pantry, w/ available kitchen island or expanded plan and formal dining rm. Master suite on main level w/ walk in closet, & master bath incl. a soaking tub, & shower. Second level can host 3 beds, and optional loft area and/or bonus rm. Main floor laundry & 2-car garage. Enjoy peace of mind with builders warranty & incredibl
Key facts
- 2 garage spots
- Listed 1490 days
Property features AI
Finance
- HOA & community: Annual association fee of $160
Exterior
- Parking: Attached 2-car garage; 2 total parking spaces
- Utilities: Public water; Public sewer; Electric service
- Home design: Single-family residence; New construction; Private ownership; One and a half levels
- Construction: New construction; Concrete basement
- Exterior features: Concrete road surface
Interior
- Kitchen: Gas water heater
- Bedrooms: 4 bedrooms total; Primary bedroom on the main level; 3 bedrooms on the upper level
- Bathrooms: 2 full bathrooms; 1 half bathroom; One full and one half bath on the main level; One full bath on the upper level
- Heating & cooling: Forced air heating (natural gas); Central electric air conditioning
- Interior features: Open floor plan; Primary bedroom on main level; Tilt-in windows; Concrete basement
- Laundry & utility: Forced air heating (natural gas)
Neighborhood map
What this means for you Summary
Snapshot
- This is a 4-bed/2.5-bath single-family listed at $335k.
Deal economics
- At list price, monthly cash flow is $-821 ($-10k/yr) — negative.
- To cash-flow at today's rent, offer at most $245k (26.8% below list).
- To meet the 1% rule (rent ≥ 1% of price), the offer needs to be $216k (35.5% below list).
- Recommended offer: $216k (35.5% below list) — sets the bar for 1% rule.
- Cap rate 3.6% vs local median 6.2% in Black Jack — below-typical yield; the buyer is paying a premium for something (appreciation thesis, condition, location) that the cap rate doesn't capture.
Location & tenants
- Location reads 70/100 on livability (#132 in MO) — a middle-class / working-renter tenant base. Strengths: cost of living A+, housing A+; Watch: health & safety C-, crime D+, amenities F.
- Hazelwood (suburban): math 11% / reading 26% proficiency, ranked #306 of 324 in MO (top 94%) — low school quality limits family demand, transient renter base, plan for 1-2y turnover.
- Zoned schools: Jury Elem. (math 5% / reading 19%, grade F, #1,016 of 1,115 statewide, top 92%, 420 students, 99% FRL); Hazelwood Central High (math 12% / reading 33%, grade F, #455 of 521 statewide, top 88%, 1,628 students, 52% FRL) — zoned schools average 75% FRL vs 53% district-wide (22 pts higher); higher-poverty schools than district average — tighter screening recommended.
- Market conditions: Rents rising fast (+7.5%/yr); 218 active listings in the ZIP; 5 comparable units currently listed for rent nearby; rentals leasing fast (median 11d on market — plan ~1-2 weeks tenant-placement turnaround); 920 units permitted in St. Louis County in 2024 (250 in 5+ unit buildings).
- This rent runs 39% of the median local income ($67k/yr) — at the standard rent-burdened threshold; future hikes will face affordability resistance.
Forward outlook
- In year one you build about $39k of equity ($3k loan paydown + $36k appreciation (10.0% local appreciation)).
- By year 2, paydown + projected appreciation supports a ~$63k cash-out refi (75% LTV) — recoverable capital for the next deal without selling this one.
Negotiation context
- It's been on market 1490 days — a 12% lower offer ($295k) is reasonable based on typical stale-listing flexibility.
Questions for the listing agent
- What do current leases actually rent for vs. the listed asking? Can we see a recent rent roll and the last 12 months of T-12 income?
- It's been on market 1490 days. Have you received any prior offers? Is the seller open to a 35% concession, seller financing, or rate buy-down credit?
- What does the HOA fee cover, when was the last increase, and are there any pending special assessments or reserve-fund shortfalls?
- Why hasn't it sold? Are there any deal-killer items the seller is aware of (foundation, flood, title, zoning, code violations)?
- Is there a deadline driving the sale (1031 exchange, divorce, estate, relocation)? That informs how much negotiation room exists.
- Crime grade is D in this area — have there been break-ins, vandalism, or insurance claims at this property in the last 3 years? What carrier currently insures it and at what premium?
- The area grade is low — what's the realistic commute time and amenity access for the typical tenant pool here? Any planned neighborhood developments (good or bad) we should know about?
- What's the average days-on-market for RENTAL listings here right now (not sales)? A rising rental-DOM trend means longer vacancies and softer asking-rent achievability than the comps imply.
- What's the recent tenant-quality profile in this submarket — average credit score on applications, eviction rate, late-payment / NSF rate, and stable-employment percentage? A property-management company in the area should have these aggregated.
- How much new for-sale + rental construction is in the pipeline within 1–3 miles? Heavy new supply typically softens prices + rents 12–24 months out; constrained supply supports both.
Investment metrics
- 1% rule
- 0.59% ✗
- Cap rate
- 3.59%
- Cash-on-cash
- -9.67%
- DSCR
- 0.57
- GRM
- 14.0
CMA / ARV
- ARV (median comp)
- $363,988
- List price
- $334,900
- Delta
- -7.99%
- Verdict
- FAIR
- Comps
- 20 within 1.0 mi
Show comp detail 12 sales within ~0.75 mi
| Address | Dist | Beds/Ba | Sqft | Sold | Price | $/sf | Match |
|---|---|---|---|---|---|---|---|
| 12 Wild Ridge/ Sawgrass | 0.00mi | 4/2.5 | 2,500 (+0%) | 4mo | $424,439 | $170 | 96 |
| 23 Wild Ridge Sawgrass | 0.00mi | 4/2.5 | 2,491 (0%) | 20mo | $398,127 | $160 | 84 |
| 2 Silverbrook Dr | 0.25mi | 3/3.0 (-1) | 2,428 (-2%) | 9mo | $279,900 | $115 | 70 |
| 4325 Tanglebrook Dr | 0.29mi | 4/3.0 | 2,688 (+8%) | 5mo | $299,900 | $112 | 67 |
| 40 Hiddenbrook Dr | 0.32mi | 3/2.0 (-1) | 2,494 (+0%) | 15mo | $249,900 | $100 | 66 |
| 8 Canoebrook Dr | 0.22mi | 3/2.0 (-1) | 2,717 (+9%) | 4mo | $255,900 | $94 | 64 |
| 11 Van Crest Ln | 0.39mi | 3/3.0 (-1) | 2,412 (-3%) | 13mo | $202,000 | $84 | 58 |
| 20 Hiddenbrook Dr | 0.32mi | 3/3.0 (-1) | 2,800 (+12%) | 7mo | $300,000 | $107 | 52 |
| 3650 Estates Dr | 0.75mi | 3/2.0 (-1) | 2,511 (+1%) | 9mo | $189,900 | $76 | 49 |
| 4223 Miletus Dr | 0.67mi | 3/3.0 (-1) | 2,700 (+8%) | 14mo | $157,400 | $58 | 36 |
| 21 Rolling Hills Dr | 0.58mi | 3/2.0 (-1) | 2,812 (+13%) | 18mo | $230,000 | $82 | 30 |
| 4 Roan Cir | 0.73mi | 3/2.0 (-1) | 2,789 (+12%) | 14mo | $275,000 | $99 | 27 |
Match score weights: distance 35% · size 25% · config 20% · recency 20%. Top-matched comps best support the ARV.
Projected returns pro-forma
10.0% appreciation · 7.51% rent growth · sell at horizon
- IRR
- 18.6%
- Equity multiple
- 2.53×
- Total profit
- $156,216
- Equity at exit
- $327,909
- IRR
- 18.1%
- Equity multiple
- 6.16×
- Total profit
- $526,164
- Equity at exit
- $707,149
Cash invested: $101,917 (down + closing). Projections, not guarantees.
Landlord ↔ Tenant lean methodology
- Overall (STATE)
- 81 Strongly Landlord-Friendly
- State Missouri
- 81 Strongly Landlord-Friendly · R+10
- County
- — inherits STATE
- City
- — inherits STATE
ZIP-level market 63033
- Home prices YoY
- 2.5%
- Rents YoY
- 7.5%
- Active inventory
- 218
- Price-to-rent
- 12.9×
Monthly cashflow live
- Estimated rent
- $2,161 high interval (Pro) →
- Mortgage (P&I)
- −$1,909
- Tax est. 1.5%
- −$455 /mo · $5,460/yr
- Insurance
- −$152
- HOA
- −$13
- Vacancy / Maint / Mgmt
- −$454
- Net cashflow
- $-821
Break-even live
UW: 25.0% down · 7.5% · 30yr · 1.5% tax · 5.0% vac · 8.0% maint · 8.0% mgmt
Financing live
Cash to close
- Down payment
- $90,997
- Closing costs
- $10,920
- Reserves months
- —
- Total cash needed
- —
Loan-product check · same deal, 3 products live
Conventional
25% down · 7.5% · 30yr
- Down + closing
- —
- Monthly P&I
- —
- Monthly cashflow
- —
- DSCR
- —
- Eligible?
- —
Personal DTI + credit; lowest rate.
DSCR
20% down · 8.5% · 30yr
- Down + closing
- —
- Monthly P&I
- —
- Monthly cashflow
- —
- DSCR
- —
- Eligible?
- —
No personal income docs; deal must DSCR.
Hard money
10% down · 12.0% · 12mo
- Down + closing
- —
- Monthly P&I
- —
- Monthly cashflow
- —
- DSCR
- —
- Eligible?
- —
Short-term bridge; refi at stabilization.
Rent comps 5 comps
| Address | Beds | Baths | Sqft | Rent | $/sqft | DOM | Units | Dist |
|---|---|---|---|---|---|---|---|---|
| 4440 Parker Rd Black Jack, MO | 3.0 | 2.0 | 1900 | $1,711 | $0.90 | 1d | 1 | 0.38mi |
| 4583 Whisper Lake Dr Black Jack, MO | 1.0–5.0 | 1.0–2.5 | 1225 | $1,354 | $1.10 | 1d | 17 | 0.44mi |
| 13538 Paddock Ridge Ct Black Jack, MO | 5.0 | 4.0 | 2789 | $2,500 | $0.90 | 10d | 1 | 0.55mi |
| 5320 Springtrail Dr Black Jack, MO | 4.0 | 2.5 | 1712 | $2,390 | $1.40 | 21d | 1 | 1.23mi |
| 5364 Trailview Dr Black Jack, MO | 4.0 | 3.0 | 1992 | $2,330 | $1.17 | 21d | 1 | 1.26mi |
HOA detail
- Monthly dues
- $13 · $156/yr
Listing history 17 events
-
2026-06-18days on market $334,900 Active 1490 DOM
-
2026-06-17days on market $334,900 Active 1489 DOM
-
2026-06-16days on market $334,900 Active 1488 DOM
-
2026-06-15days on market $334,900 Active 1487 DOM
-
2026-06-13days on market $334,900 Active 1485 DOM
-
2026-06-13days on market $334,900 Active 1484 DOM
-
2026-06-09days on market $334,900 Active 1481 DOM
-
2026-06-08days on market $334,900 Active 1480 DOM
-
2026-06-07days on market $334,900 Active 1479 DOM
-
2026-06-05days on market $334,900 Active 1476 DOM
-
2026-06-03days on market $334,900 Active 1475 DOM
-
2026-06-02days on market $334,900 Active 1474 DOM
-
2026-06-01days on market $334,900 Active 1473 DOM
-
2026-05-31days on market $334,900 Active 1472 DOM
-
2024-02-02price $334,900
-
2022-06-06price $329,900
-
2022-05-20$319,900 Active
ⓘ Source: listings_history table (triggers on properties + properties_extension) + one-shot
backfill from property_details.listing_events for pre-trigger history.
Climate risk First Street
- Flood 1/10 Low FEMA zone X (unshaded) · 0% chance over 30 yrs
- Wildfire 1/10 Low
- Heat 4/10 Moderate 7 d/yr ≥106°F today · 21 d/yr by 30 yrs out
- Wind 2/10 Low 100% chance of damaging wind over 30 yrs
- Air quality 3/10 Moderate 3 unhealthy d/yr today · 5 by 30 yrs out
Nearby sold comps map
Loading sold comps map…
Walkable amenities ~0.75 mi
Loading nearby amenities…
Taxation est. · year 1
- Rental income
- $25,930
- − Mortgage interest
- −$20,389
- − Property taxes
- −$5,460
- − Insurance
- −$1,820
- − Repairs & maintenance
- −$2,074
- − Management
- −$2,074
- − HOA
- −$156
- − Depreciation
- −$10,589
- Taxable loss
- −$16,632
- Est. tax savings @ 24.0%
- +$3,992
- After-tax cash flow
- $-5,865/yr
For passive investors: Depreciation is non-cash, so a rental often shows a tax loss while cash-flowing — sheltering income. Rental losses are passive: they offset passive income freely, and up to $25,000/yr can offset ordinary (W-2) income if you actively participate and your MAGI is under $100k (phasing out to $0 by $150k); unused losses carry forward. On sale, claimed depreciation is recaptured at up to 25%, and gains may owe capital-gains tax (a 1031 exchange can defer both). Figures are a year-1 estimate at your 24.0% rate — not tax advice; consult a CPA.
Schools (NCES district)
- District
- Hazelwood
- NCES district ID
- 2913830
- Math proficiency
- 11% ▼ -13.00%
- Reading proficiency
- 26% ▼ -6.00%
- Median HH income
- $51,621
- Composite
- 16.77/100
- National rank
- #9156
- State rank
- #306 of 324 in MO
Livability — Black Jack
- Score
- 70/100
- State rank
- #132
- US rank
- #7706
Category grades
Schools grade is shown separately in the Schools card above.
Census & demographics
- Census place
- Black Jack, MO
- County
- Saint Louis County · 888,823 people
- City population
- 42,258
- Metro
- St. Louis, MO-IL
- Population (ZIP)
- 43,056
- Household income
- $66,776
- Rent vs Own
- Severe rent burden
- 1429.0
Population outlook (St. Louis County) Hauer SSP2
- Today (2025)
- 1,025,227 people
- By 2030
- 1,028,023 · +0.3%
- By 2040
- 1,020,940 · -0.4%
- By 2050
- 1,007,280 · -1.8%
- By 2075
- 987,277 · -3.7%
- By 2100
- 921,984 · -10.1%
Race, ethnicity, and origin ACS 2023
- Neighborhood character
- Predominantly Black (71%)
- Race & ethnicity
- Black 71% White 23% Two or more races 4% Hispanic / Latino 1%
- Common ancestry
- Romanian 1% Lithuanian 1% Italian 1%
- Foreign-born
- 3% · Canada, Vietnam
- Languages at home
- 95% English-only · Spanish 1% French/Haitian/Cajun 1%
Political lean MEDSL · St. Louis
- 2024 margin
- Strong D (+23.4) · D 60.8% · R 37.4% · Other 1.7%
- 2008→2024 swing
- +3.5pp toward D · 2008: 19.9pp · 2024: 23.4pp
- All cycles
- 2024: D+23.4 2020: D+24.0 2016: D+16.2 2012: D+13.7 2008: D+19.9
Not yet ingested
- Civics
- —
Market trends
- HPI YoY
- ▲ 13.78%
- Current HPI
- 570.6
- Rent YoY
- ▲ 7.51%
- Metro
- St. Louis, MO-IL
- State GDP YoY
- ▲ 1.84%
- F500 in state
- 20
Industry mix (Fortune 500 HQ in MO)
| Industry | F500 HQs | Revenue |
|---|---|---|
| Healthcare | 1 | $163B |
|
||
| Insurance | 1 | $21B |
|
||
| Industrial Technology | 1 | $17B |
|
||
| Retail | 1 | $16B |
|
||
| Industrial Distribution | 1 | $10B |
|
||
| Utilities | 1 | $9B |
|
||
Price history
+4.7% since first listed3 events — show timeline
- 2024-02-02 Price Changed $334,900 MARIS as Distributed by MLS Grid
- 2022-06-06 Price Changed $329,900 MARIS as Distributed by MLS Grid
- 2022-05-20 Listed $319,900 MARIS as Distributed by MLS Grid
Cash-flow waterfall
monthlySold comps — $/sqft
last 12 mo · ≤1 miLoading sold comps…