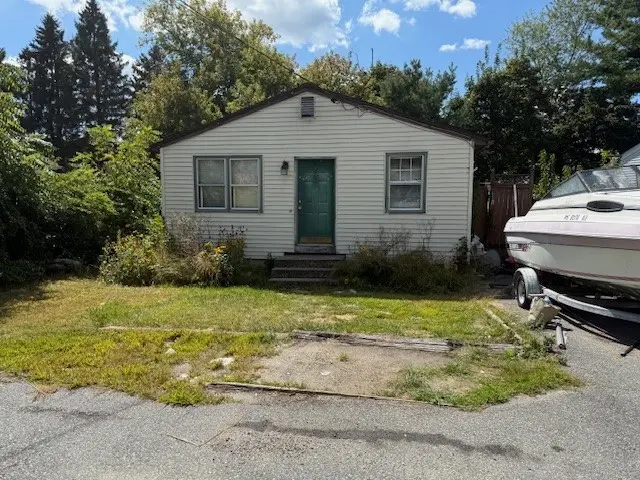
3 Quail St
Cumberland, RI 02864
$300,000D-
3 bd · 1.0 ba ·
912 sqft ·
Built 1982
· SingleFamily
· Active
· 232 DOM
Cashflow @ list (25.0% down · 7.5%)
Estimated rent
$2,130/mo
Mortgage (P&I)
−$1,573
Tax + insurance
−$404
HOA
−$0
Vac / Maint / Mgmt
−$447
Net cashflow
$-295/mo
Annual
$-3,535/yr
Cap rate
5.11%
Cash-on-cash
-4.21%
DSCR
0.81
1% rule
0.71%
Cash to close
$84,000
Investor read
- This is a 3-bed/1.0-bath single-family listed at $300k.
- At list price, monthly cash flow is $-295 ($-4k/yr) — negative.
- To cash-flow at today's rent, offer at most $248k (17.3% below list).
- To meet the 1% rule (rent ≥ 1% of price), the offer needs to be $213k (29.0% below list).
- It's been on market 232 days — a 12% lower offer ($264k) is reasonable based on typical stale-listing flexibility.
- Recommended offer: $213k (29.0% below list) — sets the bar for 1% rule.
- Local home prices are declining (-3.0%/yr); year-one equity from $2k of loan paydown is wiped out by about $9k of value loss. Plan a longer hold.
- Location reads: area grade D — affects rentability + tenant quality, not the cash-flow math above.
- Cumberland (suburban): math 40% / reading 52% proficiency, ranked #9 of 39 in RI (top 23%) — families likely to look elsewhere, expect single-tenant / working-renter base with shorter leases; only 18% free/reduced lunch — higher-income household profile.
- Market conditions: Rents soft (-1.5%/yr); 141 active listings in the ZIP; 6 comparable units currently listed for rent nearby; rentals at typical pace (median 24d on market — plan ~3-4 weeks tenant-placement turnaround); high-income renter base; 776 units permitted in Providence County in 2024 (229 in 5+ unit buildings).
- Providence County population projected at +5% by 2050 — modest demand growth; plan on rents tracking national, not racing it.
- 4 sale attempts since 26y ago; this cycle's ask has dropped $20k (6%) from the opening price — seller is motivated, your offer sets the floor, not the list.
- Current owner paid $210k; 43% above their basis — modest negotiation headroom, anchor on the comps not their cost.
- Climate carrying-cost: major wind risk, 64% chance of damaging wind over 30y — expect insurance premiums to compound above CPI over the hold.
Questions for listing agent
- What do current leases actually rent for vs. the listed asking? Can we see a recent rent roll and the last 12 months of T-12 income?
- It's been on market 232 days. Have you received any prior offers? Is the seller open to a 29% concession, seller financing, or rate buy-down credit?
- Why hasn't it sold? Are there any deal-killer items the seller is aware of (foundation, flood, title, zoning, code violations)?
- Is there a deadline driving the sale (1031 exchange, divorce, estate, relocation)? That informs how much negotiation room exists.
- The area grade is low — what's the realistic commute time and amenity access for the typical tenant pool here? Any planned neighborhood developments (good or bad) we should know about?
- What's the average days-on-market for RENTAL listings here right now (not sales)? A rising rental-DOM trend means longer vacancies and softer asking-rent achievability than the comps imply.
- What's the recent tenant-quality profile in this submarket — average credit score on applications, eviction rate, late-payment / NSF rate, and stable-employment percentage? A property-management company in the area should have these aggregated.
- How much new for-sale + rental construction is in the pipeline within 1–3 miles? Heavy new supply typically softens prices + rents 12–24 months out; constrained supply supports both.
CashFlowRE · CFR-233Z4576FAN2VB
· Data 1 day ago
cashflowre.app · 2026-05-29