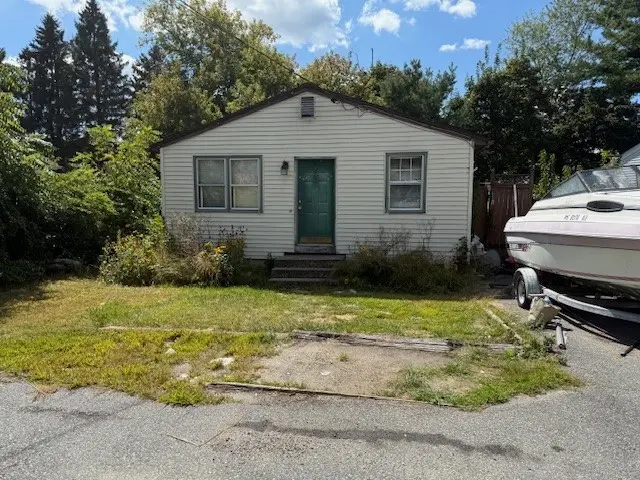
3 Quail St · Cumberland, RI
Flood risk 1/10 · Minimal
- FEMA flood zone
- X (unshaded)
- Chance of flooding over 30 yrs
- 0.0%
- Est. flood insurance / yr
- $473 – $860
Fire risk 1/10 · Minimal
- Est. fire insurance / yr
- $835 – $1,551
Heat risk 4/10 · Minor
- Hot days now (above 95°F)
- 7 days/yr
- Hot days in 30 yrs
- 15 days/yr
Wind risk 6/10 · Moderate
- Chance of severe wind over 30 yrs
- 64.0%
Air-quality risk 2/10 · Minimal
- Unhealthy air days now
- 1 days/yr
- Unhealthy air days in 30 yrs
- 2 days/yr
Risk factors via First Street. Map © Google.
Why this score? — see what drove the D- grade
The composite is a weighted blend of 9 inputs, each scored 0–100. Each bar is that input's sub-score; the figure is the points it added to the 100-point composite (weight × sub-score).
- ARV discount +15.0/15.0
- Cash flow +8.1/30.0
- Schools +4.2/10.0
- Livability +2.5/5.0
- Condition / age +2.5/5.0
- 1% rule +2.1/10.0
- DSCR +2.1/10.0
- Rent growth +2.1/5.0
- Appreciation +0.0/10.0
$300,000
🖨 Deal sheet 📄 Offer letter ✓ Due diligence
Listing remarks MLS
Opportunity in the lovely town of Cumberland, 3-Bedroom ranch cottage with a parking space and rear yard. Great residential area, near highways and town amenities. Occupied, do not approach property.
Key facts
- Rear yard
- Residential area
- Ranch cottage
Tags
Neighborhood map
What this means for you Summary
Snapshot
- This is a 3-bed/1.0-bath single-family listed at $300k.
Deal economics
- At list price, monthly cash flow is $-295 ($-4k/yr) — negative.
- To cash-flow at today's rent, offer at most $248k (17.3% below list).
- To meet the 1% rule (rent ≥ 1% of price), the offer needs to be $213k (29.0% below list).
- Recommended offer: $213k (29.0% below list) — sets the bar for 1% rule.
Location & tenants
- Location reads: area grade D — affects rentability + tenant quality, not the cash-flow math above.
- Cumberland (suburban): math 40% / reading 52% proficiency, ranked #9 of 39 in RI (top 23%) — families likely to look elsewhere, expect single-tenant / working-renter base with shorter leases; only 18% free/reduced lunch — higher-income household profile.
- Market conditions: Rents soft (-1.5%/yr); 141 active listings in the ZIP; 6 comparable units currently listed for rent nearby; rentals at typical pace (median 24d on market — plan ~3-4 weeks tenant-placement turnaround); high-income renter base; 776 units permitted in Providence County in 2024 (229 in 5+ unit buildings).
Forward outlook
- Local home prices are declining (-3.0%/yr); year-one equity from $2k of loan paydown is wiped out by about $9k of value loss. Plan a longer hold.
- Providence County population projected at +5% by 2050 — modest demand growth; plan on rents tracking national, not racing it.
Negotiation context
- It's been on market 232 days — a 12% lower offer ($264k) is reasonable based on typical stale-listing flexibility.
- 4 sale attempts since 26y ago; this cycle's ask has dropped $20k (6%) from the opening price — seller is motivated, your offer sets the floor, not the list.
- Current owner paid $210k; 43% above their basis — modest negotiation headroom, anchor on the comps not their cost.
Risks & watch-outs
- Climate carrying-cost: major wind risk, 64% chance of damaging wind over 30y — expect insurance premiums to compound above CPI over the hold.
Questions for the listing agent
- What do current leases actually rent for vs. the listed asking? Can we see a recent rent roll and the last 12 months of T-12 income?
- It's been on market 232 days. Have you received any prior offers? Is the seller open to a 29% concession, seller financing, or rate buy-down credit?
- Why hasn't it sold? Are there any deal-killer items the seller is aware of (foundation, flood, title, zoning, code violations)?
- Is there a deadline driving the sale (1031 exchange, divorce, estate, relocation)? That informs how much negotiation room exists.
- The area grade is low — what's the realistic commute time and amenity access for the typical tenant pool here? Any planned neighborhood developments (good or bad) we should know about?
- What's the average days-on-market for RENTAL listings here right now (not sales)? A rising rental-DOM trend means longer vacancies and softer asking-rent achievability than the comps imply.
- What's the recent tenant-quality profile in this submarket — average credit score on applications, eviction rate, late-payment / NSF rate, and stable-employment percentage? A property-management company in the area should have these aggregated.
- How much new for-sale + rental construction is in the pipeline within 1–3 miles? Heavy new supply typically softens prices + rents 12–24 months out; constrained supply supports both.
Investment metrics
- 1% rule
- 0.71% ✗
- Cap rate
- 5.11%
- Cash-on-cash
- -4.21%
- DSCR
- 0.81
- GRM
- 11.7
CMA / ARV
- ARV (median comp)
- $439,521
- List price
- $300,000
- Delta
- -31.74%
- Verdict
- UNDERPRICED
- Comps
- 20 within 1.0 mi
Show comp detail 3 sales within ~0.75 mi
| Address | Dist | Beds/Ba | Sqft | Sold | Price | $/sf | Match |
|---|---|---|---|---|---|---|---|
| 44 Quail St | 0.06mi | 2/1.0 (-1) | 960 (+5%) | 10mo | $360,000 | $375 | 75 |
| 33 Grand Ave | 0.26mi | 2/1.0 (-1) | 864 (-5%) | 22mo | $240,000 | $278 | 56 |
| 23 Legion Ave | 0.69mi | 2/1.0 (-1) | 912 (0%) | 12mo | $380,000 | $417 | 53 |
Match score weights: distance 35% · size 25% · config 20% · recency 20%. Top-matched comps best support the ARV.
Projected returns pro-forma
-3.0% appreciation · 0.0% rent growth · sell at horizon
- IRR
- -26.6%
- Equity multiple
- 0.12×
- Total profit
- $-73,641
- Equity at exit
- $44,731
- IRR
- -37.6%
- Equity multiple
- -0.34×
- Total profit
- $-112,513
- Equity at exit
- $25,939
Cash invested: $84,000 (down + closing). Projections, not guarantees.
Landlord ↔ Tenant lean methodology
- Overall (STATE)
- 31 Tenant-Leaning
- State Rhode Island
- 31 Tenant-Leaning · D+8
- County
- — inherits STATE
- City
- — inherits STATE
ZIP-level market 02864
- Rents YoY
- -1.5%
- Active inventory
- 141
- Price-to-rent
- 11.7×
Monthly cashflow live
- Estimated rent
- $2,130 high interval (Pro) →
- Mortgage (P&I)
- −$1,573
- Tax from tax record
- −$279 /mo · $3,347/yr
- Insurance
- −$125
- HOA
- −$0
- Vacancy / Maint / Mgmt
- −$447
- Net cashflow
- $-295
Break-even live
UW: 25.0% down · 7.5% · 30yr · 1.5% tax · 5.0% vac · 8.0% maint · 8.0% mgmt
Financing live
Cash to close
- Down payment
- $75,000
- Closing costs
- $9,000
- Reserves months
- —
- Total cash needed
- —
Loan-product check · same deal, 3 products live
Conventional
25% down · 7.5% · 30yr
- Down + closing
- —
- Monthly P&I
- —
- Monthly cashflow
- —
- DSCR
- —
- Eligible?
- —
Personal DTI + credit; lowest rate.
DSCR
20% down · 8.5% · 30yr
- Down + closing
- —
- Monthly P&I
- —
- Monthly cashflow
- —
- DSCR
- —
- Eligible?
- —
No personal income docs; deal must DSCR.
Hard money
10% down · 12.0% · 12mo
- Down + closing
- —
- Monthly P&I
- —
- Monthly cashflow
- —
- DSCR
- —
- Eligible?
- —
Short-term bridge; refi at stabilization.
Rent comps 6 comps
| Address | Beds | Baths | Sqft | Rent | $/sqft | DOM | Units | Dist |
|---|---|---|---|---|---|---|---|---|
| 40 Bouvier Ave Manville, RI | 1.0–2.0 | 1.0 | 694 | $1,975 | $2.84 | 1d | 1 | 0.78mi |
| 200 Manville Hill Rd #108 Cumberland, RI | 2.0 | 1.0 | 918 | $1,800 | $1.96 | 23d | 1 | 0.81mi |
| 3400 Mendon Rd Unit 2 Cumberland, RI | 2.0 | 1.0 | 700 | $1,700 | $2.43 | 2d | 1 | 0.83mi |
| 114 Summer St Unit 1 Manville, RI | 2.0 | 1.0 | 992 | $1,700 | $1.71 | 43d | 1 | 1.01mi |
| 375 Old River Rd Unit 1 Manville, RI | 3.0 | 1.0 | 852 | $1,900 | $2.23 | 23d | 1 | 1.06mi |
| 1037 Cass Ave Woonsocket, RI | 2.0 | 1.0 | 860 | $1,975 | $2.30 | 1d | 1 | 1.47mi |
Listing history 26 events
-
2026-06-18days on market $300,000 Active 232 DOM
-
2026-06-17days on market $300,000 Active 231 DOM
-
2026-06-16days on market $300,000 Active 230 DOM
-
2026-06-15days on market $300,000 Active 229 DOM
-
2026-06-13days on market $300,000 Active 227 DOM
-
2026-06-09days on market $300,000 Active 223 DOM
-
2026-06-08days on market $300,000 Active 222 DOM
-
2026-06-07days on market $300,000 Active 221 DOM
-
2026-06-05days on market $300,000 Active 218 DOM
-
2026-06-03days on market $300,000 Active 217 DOM
-
2026-06-02days on market $300,000 Active 216 DOM
-
2026-06-01days on market $300,000 Active 215 DOM
-
2026-05-31days on market $300,000 Active 214 DOM
-
2026-05-20price $300,000 199-char remark
Show marketing remark (199 chars)
Opportunity in the lovely town of Cumberland, 3-Bedroom ranch cottage with a parking space and rear yard. Great residential area, near highways and town amenities. Occupied, do not approach property.
-
2025-10-29$320,000 Active 199-char remark
Show marketing remark (199 chars)
Opportunity in the lovely town of Cumberland, 3-Bedroom ranch cottage with a parking space and rear yard. Great residential area, near highways and town amenities. Occupied, do not approach property.
-
2025-07-11historical
-
2025-06-29status Active
-
2025-06-29price $320,000
-
2025-03-27status Pending
-
2025-01-16price $300,000
-
2024-11-21$370,000 Active
-
2005-01-19soldstatus $210,000
-
2000-12-18soldstatus $122,500
-
2000-12-15soldstatus $122,500
-
2000-11-05historical
-
2000-10-23$126,000
ⓘ Source: listings_history table (triggers on properties + properties_extension) + one-shot
backfill from property_details.listing_events for pre-trigger history.
Tax reassessment forecast RI · Partial reset (capped growth)
- Current annual tax
- $3,347 · $279/mo
- Projected year-2 tax
- $4,118 · $343/mo
- Expected delta
- +$772/yr (+$64/mo · 23.1%)
ⓘ Screening estimate from a state-policy table — verify with the county assessor before closing.
Climate risk First Street
- Flood 1/10 Low FEMA zone X (unshaded) · 0% chance over 30 yrs
- Wildfire 1/10 Low
- Heat 4/10 Moderate 7 d/yr ≥95°F today · 15 d/yr by 30 yrs out
- Wind 6/10 Major 64% chance of damaging wind over 30 yrs
- Air quality 2/10 Low 1 unhealthy d/yr today · 2 by 30 yrs out
Nearby sold comps map
Loading sold comps map…
Walkable amenities ~0.75 mi
Loading nearby amenities…
Taxation est. · year 1
- Rental income
- $25,559
- − Mortgage interest
- −$16,805
- − Property taxes
- −$3,347
- − Insurance
- −$1,500
- − Repairs & maintenance
- −$2,045
- − Management
- −$2,045
- − Depreciation
- −$8,727
- Taxable loss
- −$8,910
- Est. tax savings @ 24.0%
- +$2,138
- After-tax cash flow
- $-1,396/yr
For passive investors: Depreciation is non-cash, so a rental often shows a tax loss while cash-flowing — sheltering income. Rental losses are passive: they offset passive income freely, and up to $25,000/yr can offset ordinary (W-2) income if you actively participate and your MAGI is under $100k (phasing out to $0 by $150k); unused losses carry forward. On sale, claimed depreciation is recaptured at up to 25%, and gains may owe capital-gains tax (a 1031 exchange can defer both). Figures are a year-1 estimate at your 24.0% rate — not tax advice; consult a CPA.
Schools (NCES district)
- District
- Cumberland
- NCES district ID
- 4400270
- Math proficiency
- 40% ▼ -13.00%
- Reading proficiency
- 52% ▼ -10.00%
- Median HH income
- $75,407
- Composite
- 41.85/100
- National rank
- #3382
- State rank
- #9 of 39 in RI
Livability — Cumberland
No livability data for this city. (Only ~50 U.S. cities are tracked.)
Census & demographics
- Census place
- Cumberland Hill, RI
- County
- Providence County · 548,917 people
- City population
- 36,820
- Metro
- Providence-Warwick, RI-MA
- Population (ZIP)
- 36,820
- Household income
- $117,522
- Rent vs Own
- Severe rent burden
- 771.0
Population outlook (Providence County) Hauer SSP2
- Today (2025)
- 653,469 people
- By 2030
- 660,819 · +1.1%
- By 2040
- 672,747 · +3.0%
- By 2050
- 683,741 · +4.6%
- By 2075
- 720,435 · +10.2%
- By 2100
- 741,582 · +13.5%
Race, ethnicity, and origin ACS 2023
- Neighborhood character
- Predominantly White (83%)
- Race & ethnicity
- White 83% Hispanic / Latino 6% Two or more races 5% Asian 4% Black 3%
- Hispanic origin (detail)
- Puerto Rican 2%
- Common ancestry
- Lithuanian 11% Russian 10% Romanian 6%
- Foreign-born
- 11% · Canada, Jamaica, China
- Languages at home
- 83% English-only · Other Indo-European 7% Spanish 4% French/Haitian/Cajun 2%
Political lean MEDSL · Providence
- 2024 margin
- D (+14.4) · D 56.1% · R 41.7% · Other 2.2%
- 2008→2024 swing
- -20.0pp toward R · 2008: 34.4pp · 2024: 14.4pp
- All cycles
- 2024: D+14.4 2020: D+22.9 2016: D+21.2 2012: D+34.9 2008: D+34.4
Not yet ingested
- Civics
- —
Market trends
- HPI YoY
- ▼ -461.15%
- Current HPI
- 313.0341
- Rent YoY
- ▼ -1.48%
- Metro
- Providence-Warwick, RI-MA
- State GDP YoY
- ▲ 2.25%
- F500 in state
- 10
Industry mix (Fortune 500 HQ in RI)
| Industry | F500 HQs | Revenue |
|---|---|---|
| Healthcare | 1 | $373B |
|
||
| Food Distribution | 1 | $31B |
|
||
| Aerospace / Defense | 1 | $14B |
|
||
| Financial Services | 1 | $8B |
|
||
| Consumer Goods | 1 | $4B |
|
||
Price history
+138.1% since first listed13 events — show timeline
- 2026-05-20 Price Changed $300,000 RIS
- 2025-10-29 Listed $320,000 RIS
- 2025-07-11 Listing Removed — RIS
- 2025-06-29 Relisted — RIS
- 2025-06-29 Price Changed $320,000 RIS
- 2025-03-27 Pending — RIS
- 2025-01-16 Price Changed $300,000 RIS
- 2024-11-21 Listed $370,000 RIS
- 2005-01-19 Sold (Public Records) $210,000 Public Records
- 2000-12-18 Sold (Public Records) $122,500 Public Records
- 2000-12-15 Sold (MLS) $122,500 RIS
- 2000-11-05 Listing Removed — RIS
- 2000-10-23 Listed $126,000 RIS
Property tax history
+2.2%/yrLatest (2025): $3,347 · +2.7% YoY. Source: county tax records.
Cash-flow waterfall
monthlySold comps — $/sqft
last 12 mo · ≤1 miLoading sold comps…