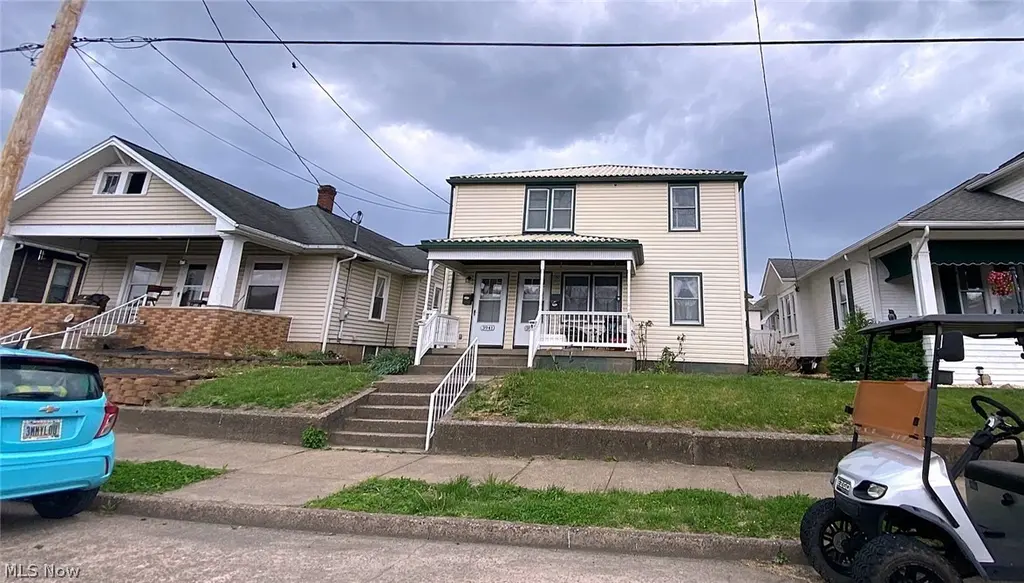
3939-3941 Highland Ave
Shadyside, OH 43947
$170,000C+
4 bd · 2.0 ba ·
1,782 sqft ·
Built 1950
· MultiFamily
· Contingent
· 60 DOM
Cashflow @ list (25.0% down · 7.5%)
Estimated rent
$2,000/mo
Mortgage (P&I)
−$891
Tax + insurance
−$308
HOA
−$0
Vac / Maint / Mgmt
−$420
Net cashflow
$380/mo
Annual
$4,564/yr
Cap rate
9.37%
Cash-on-cash
10.99%
DSCR
1.49
1% rule
1.18%
Cash to close
$47,600
Investor read
- This is a 2 × 2-bed/1.0-bath units multifamily listed at $170k.
- At list price, monthly cash flow is $380 ($5k/yr) — positive. Per door: $190/mo.
- The deal already cash-flows at list — no discount required.
- Meets the 1% rule at list price ($2k rent vs $170k).
- It's been on market 60 days — a 3% lower offer ($165k) is reasonable based on typical stale-listing flexibility.
- Recommended offer: $165k (3.0% below list) — sets the bar for market timing.
- Local home prices are declining (-3.0%/yr); year-one equity from $1k of loan paydown is wiped out by about $5k of value loss. Plan a longer hold.
- Location reads 68/100 on livability (#576 in OH) — a middle-class / working-renter tenant base. Strengths: cost of living A+, housing A+, crime A; Watch: employment D+, amenities F, commute F.
- Shadyside Local (suburban): math 47% / reading 62% proficiency, ranked #384 of 656 in OH (top 58%) — acceptable for families but not a draw, mixed tenant base, ~2y average lease.
- Zoned schools: Jefferson Ave Elementary School (222 students, 38% FRL); Shadyside High School (math 37% / reading 47%, grade F, #497 of 781 statewide, top 66%, 307 students, 0% FRL) — zoned schools average 19% FRL vs 41% district-wide (22 pts lower); this property's tenant base skews higher-income than the district average.
- Zoned-school proficiency averages 42% at this address vs 54% district-wide (-12 pts) — the specific schools serving this property underperform the Shadyside Local average; the district grade overstates school quality for this exact location.
- Watch-outs: flood insurance adds $56/mo; built in 1950 — expect roof / HVAC / electrical / plumbing capex.
- Market conditions: 15 active listings in the ZIP; 4 units permitted in Belmont County in 2024 (0 in 5+ unit buildings).
- Belmont County population projected at -15% by 2050 — secular population decline; favor cash flow + early exit over multi-decade hold.
- 2 sale attempts since 18y ago with the ask held roughly flat each time — persistent listings suggest the price (not the market) is what's stuck; bring a comps-based counter.
- Current owner paid $35k; list at $170k implies a 386% gain — meaningful room to come down on a strong offer.
- Climate carrying-cost: severe flood risk — expect insurance premiums to compound above CPI over the hold.
- This rent runs 42% of the median local income ($57k/yr) — at the standard rent-burdened threshold; future hikes will face affordability resistance.
Questions for listing agent
- It's been on market 60 days. Have you received any prior offers? Is the seller open to a 3% concession, seller financing, or rate buy-down credit?
- Can we see the unit-by-unit rent roll, current vacancy, and any below-market leases? What's the average tenancy length?
- What capital expenditures (roof, boiler, parking lot, exteriors) have been made in the last 5 years, and what's planned in the next 2?
- Built in 1950 — when were the roof, HVAC, electrical panel, plumbing, and water heater last replaced?
- What's the actual annual flood-insurance premium (NFIP or private), and is the property in a SFHA with mandatory coverage?
- Is there a deadline driving the sale (1031 exchange, divorce, estate, relocation)? That informs how much negotiation room exists.
- Schools are A-rated — typically a magnet for longer-tenancy family renters. What's the average tenant stay here, and is there a school-zone premium baked into asking?
- What's the average days-on-market for RENTAL listings here right now (not sales)? A rising rental-DOM trend means longer vacancies and softer asking-rent achievability than the comps imply.
CashFlowRE · CFR-24QA3XBXHG4W5V
· Data 12 h ago
cashflowre.app · 2026-05-29