 Duplex
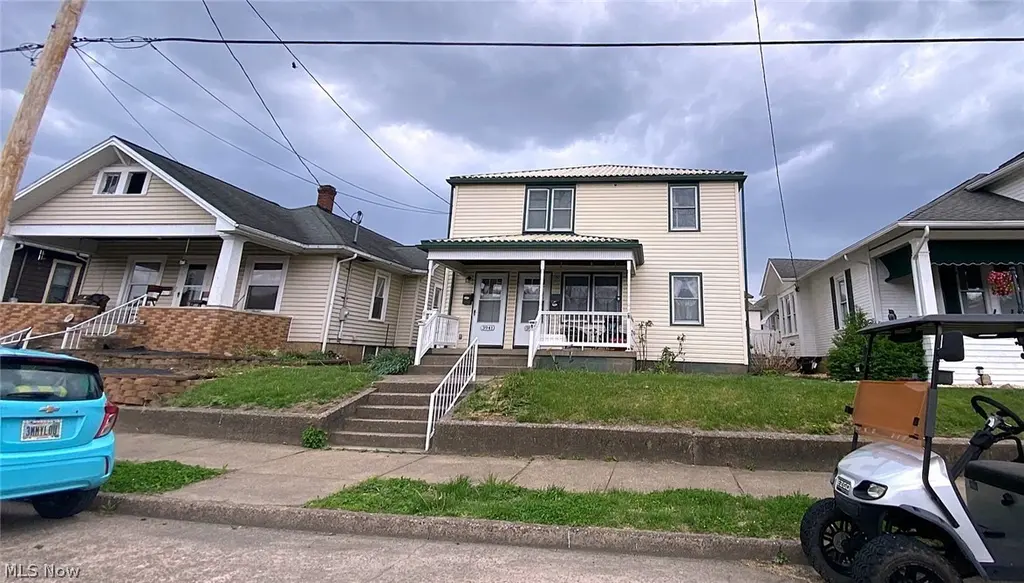
3939-3941 Highland Ave · Shadyside, OH
Flood risk 8/10 · Major
- FEMA flood zone
- X (unshaded)
- Chance of flooding over 30 yrs
- 0.78%
- Est. flood insurance / yr
- $473 – $860
Fire risk 1/10 · Minimal
- Est. fire insurance / yr
- $713 – $1,323
Heat risk 4/10 · Minor
- Hot days now (above 97°F)
- 8 days/yr
- Hot days in 30 yrs
- 22 days/yr
Wind risk 1/10 · Minimal
- Chance of severe wind over 30 yrs
- —
Air-quality risk 2/10 · Minimal
- Unhealthy air days now
- 0 days/yr
- Unhealthy air days in 30 yrs
- 1 days/yr
Risk factors via First Street. Map © Google.
Why this score? — see what drove the C+ grade
The composite is a weighted blend of 9 inputs, each scored 0–100. Each bar is that input's sub-score; the figure is the points it added to the 100-point composite (weight × sub-score).
- Cash flow +26.2/30.0
- DSCR +8.9/10.0
- ARV discount +7.5/15.0
- 1% rule +6.8/10.0
- Schools +4.6/10.0
- Livability +3.4/5.0
- Rent growth +2.5/5.0
- Condition / age +2.5/5.0
- Appreciation +0.0/10.0
$170,000
🖨 Deal sheet (PDF) 📄 Offer letter ✓ Due diligence
Multi-family units
County records classify this as Multi-Family (2-4 Unit). Listing-text estimate: 2 units. confirmed
Listing remarks MLS
Handyman Special! Priced to Sell! Great neighborhood! Lots of Possibilities! Always rented!
Key facts
- Hardwood flooring
- Separate utilities
- Updated bathrooms
Tags
Property features AI
Finance
- Other: One building on the lot; Above-grade finished area reported from public records
- Financial info: Multifamily property with 2 units (one main-level 2-bed/1-bath and one upstairs 2-bed/1-bath); one unit is currently leased
- HOA & community: No HOA information provided
Exterior
- Parking: Has garage with 2 spaces; Alley access
- Security: Security details not provided
- Utilities: Public water; Public sewer
- Home design: Two-story building; Updated / remodeled; Vinyl siding exterior; Metal roof
- Construction: Vinyl siding construction; Metal roof; Year built source: public records
- Exterior features: City lot
Interior
- Kitchen: Kitchens present in each apartment (appliance details not provided)
- Bedrooms: Two upstairs apartment — 2 bedrooms; Two main level apartment — 2 bedrooms
- Flooring: Flooring details not provided
- Bathrooms: Two full bathrooms (one in each unit)
- Heating & cooling: Central air conditioning; Forced air heating (gas)
- Interior features: Full unfinished concrete basement; Updated / remodeled condition; 8 total rooms
- Laundry & utility: Washer hookup on lower level
Neighborhood map
What this means for you Summary
Snapshot
- This is a 2 × 2-bed/1.0-bath units multifamily listed at $170k.
Deal economics
- At list price, monthly cash flow is $380 ($5k/yr) — positive. Per door: $190/mo.
- The deal already cash-flows at list — no discount required.
- Meets the 1% rule at list price ($2k rent vs $170k).
- Recommended offer: $165k (3.0% below list) — sets the bar for market timing.
Location & tenants
- Location reads 68/100 on livability (#576 in OH) — a middle-class / working-renter tenant base. Strengths: cost of living A+, housing A+, crime A; Watch: employment D+, amenities F, commute F.
- Shadyside Local (suburban): math 47% / reading 62% proficiency, ranked #384 of 656 in OH (top 58%) — acceptable for families but not a draw, mixed tenant base, ~2y average lease.
- Zoned schools: Jefferson Ave Elementary School (222 students, 38% FRL); Shadyside High School (math 37% / reading 47%, grade F, #497 of 781 statewide, top 66%, 307 students, 0% FRL) — zoned schools average 19% FRL vs 41% district-wide (22 pts lower); this property's tenant base skews higher-income than the district average.
- Zoned-school proficiency averages 42% at this address vs 54% district-wide (-12 pts) — the specific schools serving this property underperform the Shadyside Local average; the district grade overstates school quality for this exact location.
- Market conditions: 15 active listings in the ZIP; 4 units permitted in Belmont County in 2024 (0 in 5+ unit buildings).
- This rent runs 42% of the median local income ($57k/yr) — at the standard rent-burdened threshold; future hikes will face affordability resistance.
Forward outlook
- Local home prices are declining (-3.0%/yr); year-one equity from $1k of loan paydown is wiped out by about $5k of value loss. Plan a longer hold.
- Belmont County population projected at -15% by 2050 — secular population decline; favor cash flow + early exit over multi-decade hold.
Negotiation context
- It's been on market 60 days — a 3% lower offer ($165k) is reasonable based on typical stale-listing flexibility.
- 2 sale attempts since 18y ago with the ask held roughly flat each time — persistent listings suggest the price (not the market) is what's stuck; bring a comps-based counter.
- Current owner paid $35k; list at $170k implies a 386% gain — meaningful room to come down on a strong offer.
Risks & watch-outs
- Watch-outs: flood insurance adds $56/mo; built in 1950 — expect roof / HVAC / electrical / plumbing capex.
- Climate carrying-cost: severe flood risk — expect insurance premiums to compound above CPI over the hold.
Questions for the listing agent
- It's been on market 60 days. Have you received any prior offers? Is the seller open to a 3% concession, seller financing, or rate buy-down credit?
- Can we see the unit-by-unit rent roll, current vacancy, and any below-market leases? What's the average tenancy length?
- What capital expenditures (roof, boiler, parking lot, exteriors) have been made in the last 5 years, and what's planned in the next 2?
- Built in 1950 — when were the roof, HVAC, electrical panel, plumbing, and water heater last replaced?
- What's the actual annual flood-insurance premium (NFIP or private), and is the property in a SFHA with mandatory coverage?
- Is there a deadline driving the sale (1031 exchange, divorce, estate, relocation)? That informs how much negotiation room exists.
- Schools are A-rated — typically a magnet for longer-tenancy family renters. What's the average tenant stay here, and is there a school-zone premium baked into asking?
- What's the average days-on-market for RENTAL listings here right now (not sales)? A rising rental-DOM trend means longer vacancies and softer asking-rent achievability than the comps imply.
- What's the recent tenant-quality profile in this submarket — average credit score on applications, eviction rate, late-payment / NSF rate, and stable-employment percentage? A property-management company in the area should have these aggregated.
- How much new apartment / multifamily construction is in the pipeline within 1–3 miles? Heavy new supply (>2% of stock underway) typically softens rents 12–24 months out; light construction supports rent growth.
Investment metrics
- 1% rule
- 1.18% ✓
- Cap rate
- 9.37%
- Cash-on-cash
- 10.99%
- DSCR
- 1.49
- GRM
- 7.1
CMA / ARV
- ARV (median comp)
- $79,632
- List price
- $170,000
- Delta
- 113.48%
- Verdict
- OVERPRICED
- Comps
- 2 within 1.0 mi
Projected returns pro-forma
-3.0% appreciation · 3.0% rent growth · sell at horizon
- IRR
- -1.8%
- Equity multiple
- 0.93×
- Total profit
- $-3,277
- Equity at exit
- $25,348
- IRR
- 7.9%
- Equity multiple
- 1.60×
- Total profit
- $28,525
- Equity at exit
- $14,698
Cash invested: $47,600 (down + closing). Projections, not guarantees.
Landlord ↔ Tenant lean methodology
- Overall (STATE)
- 73 Landlord-Friendly
- State Ohio
- 73 Landlord-Friendly · R+6
- County
- — inherits STATE
- City
- — inherits STATE
ZIP-level market 43947
- Home prices YoY
- -12.9%
- Active inventory
- 15
- Price-to-rent
- 14.2×
Monthly cashflow live
- Estimated rent
- $2,000 medium interval (Pro) →
- Mortgage (P&I)
- −$891
- Tax from tax record
- −$182 /mo · $2,181/yr
- Insurance
- −$71
- Flood insurance flood zone
- −$56 /mo · $666/yr
- HOA
- −$0
- Vacancy / Maint / Mgmt
- −$420
- Net cashflow
- $380
Break-even live
Sensitivity live
| Price | -10% $477 | -5% $428 | +0% $380 | +5% $332 | +10% $284 |
|---|---|---|---|---|---|
| Rent | -10% $222 | -5% $301 | +0% $380 | +5% $459 | +10% $538 |
| Rate | -1.0pp $466 | -0.5pp $424 | base $380 | +0.5pp $336 | +1.0pp $291 |
2-unit breakdown (identical units grouped — click to expand)
| Units | Beds | Baths | Est. rent |
|---|---|---|---|
| 2× units | 2 | 1 | $2,000 |
| #1 | 2 | 1 | $1,000 |
| #2 | 2 | 1 | $1,000 |
| Total (2 units) | $2,000 | ||
UW: 25.0% down · 7.5% · 30yr · 1.5% tax · 5.0% vac · 8.0% maint · 8.0% mgmt
Financing live
Cash to close
- Down payment
- $42,500
- Closing costs
- $5,100
- Reserves months
- —
- Total cash needed
- —
Loan-product check · same deal, 3 products live
Conventional
25% down · 7.5% · 30yr
- Down + closing
- —
- Monthly P&I
- —
- Monthly cashflow
- —
- DSCR
- —
- Eligible?
- —
Personal DTI + credit; lowest rate.
DSCR
20% down · 8.5% · 30yr
- Down + closing
- —
- Monthly P&I
- —
- Monthly cashflow
- —
- DSCR
- —
- Eligible?
- —
No personal income docs; deal must DSCR.
Hard money
10% down · 12.0% · 12mo
- Down + closing
- —
- Monthly P&I
- —
- Monthly cashflow
- —
- DSCR
- —
- Eligible?
- —
Short-term bridge; refi at stabilization.
Listing history 20 events
-
2026-06-21days on market $170,000 Contingent 60 DOM
-
2026-06-21statusdays on market $170,000 Contingent 59 DOM
-
2026-06-18days on market $170,000 Active 57 DOM
-
2026-06-17days on market $170,000 Active 56 DOM
-
2026-06-16days on market $170,000 Active 55 DOM
-
2026-06-15days on market $170,000 Active 54 DOM
-
2026-06-13days on market $170,000 Active 52 DOM
-
2026-06-12days on market $170,000 Active 51 DOM
-
2026-06-09days on market $170,000 Active 48 DOM
-
2026-06-08days on market $170,000 Active 47 DOM
-
2026-06-08days on market $170,000 Active 46 DOM
-
2026-06-07days on market $170,000 Active 45 DOM
-
2026-06-04days on market $170,000 Active 42 DOM
-
2026-06-02days on market $170,000 Active 41 DOM
-
2026-06-01days on market $170,000 Active 40 DOM
-
2026-05-31days on market $170,000 Active 39 DOM
-
2026-04-20$170,000 Active 1055-char remark
-
2008-12-11soldstatus $35,000
-
2008-12-01soldstatus $35,000 96-char remark
Show marketing remark (96 chars)
Handyman Special! Priced to Sell! Great neighborhood! Lots of Possibilities! Always rented!
-
2008-11-25$42,900 96-char remark
Show marketing remark (96 chars)
Handyman Special! Priced to Sell! Great neighborhood! Lots of Possibilities! Always rented!
ⓘ Source: listings_history table (triggers on properties + properties_extension) + one-shot
backfill from property_details.listing_events for pre-trigger history.
Tax reassessment forecast OH · Partial reset (capped growth)
- Current annual tax
- $2,181 · $182/mo
- Projected year-2 tax
- $2,417 · $201/mo
- Expected delta
- +$235/yr (+$20/mo · 10.8%)
ⓘ Screening estimate from a state-policy table — verify with the county assessor before closing.
Climate risk First Street
- Flood 8/10 Severe FEMA zone X (unshaded) · 78% chance over 30 yrs
- Wildfire 1/10 Low
- Heat 4/10 Moderate 8 d/yr ≥97°F today · 22 d/yr by 30 yrs out
- Wind 1/10 Low
- Air quality 2/10 Low 0 unhealthy d/yr today · 1 by 30 yrs out
Nearby sold comps map
Loading sold comps map…
Walkable amenities ~0.75 mi
Loading nearby amenities…
Taxation est. · year 1
- Rental income
- $24,000
- − Mortgage interest
- −$9,523
- − Property taxes
- −$2,181
- − Insurance
- −$1,516
- − Repairs & maintenance
- −$1,920
- − Management
- −$1,920
- − Depreciation
- −$4,945
- Taxable income
- $1,994
- Est. tax owed @ 24.0%
- −$479
- After-tax cash flow
- $4,086/yr
For passive investors: Depreciation is non-cash, so a rental often shows a tax loss while cash-flowing — sheltering income. Rental losses are passive: they offset passive income freely, and up to $25,000/yr can offset ordinary (W-2) income if you actively participate and your MAGI is under $100k (phasing out to $0 by $150k); unused losses carry forward. On sale, claimed depreciation is recaptured at up to 25%, and gains may owe capital-gains tax (a 1031 exchange can defer both). Figures are a year-1 estimate at your 24.0% rate — not tax advice; consult a CPA.
Schools (NCES district)
- District
- Shadyside Local
- NCES district ID
- 3904600
- Math proficiency
- 47% ▼ -14.00%
- Reading proficiency
- 62% ▼ -6.00%
- Median HH income
- $45,519
- Composite
- 46.03/100
- National rank
- #2525
- State rank
- #384 of 656 in OH
Livability — Shadyside
- Score
- 68/100
- State rank
- #576
- US rank
- #9818
Category grades
Schools grade is shown separately in the Schools card above.
Census & demographics
- Census place
- Shadyside, OH
- County
- Belmont · 63,139 people
- Metro
- Wheeling, WV-OH
- Population (ZIP)
- 4,894
- Household income
- $57,258
- Rent vs Own
- Severe rent burden
- 12.9
Population outlook (Belmont County) Hauer SSP2
- Today (2025)
- 66,568 people
- By 2030
- 64,818 · -2.6%
- By 2040
- 60,702 · -8.8%
- By 2050
- 56,427 · -15.2%
- By 2075
- 46,222 · -30.6%
- By 2100
- 34,611 · -48.0%
Race, ethnicity, and origin ACS 2023
- Neighborhood character
- Predominantly White (96%)
- Race & ethnicity
- White 96% Two or more races 3%
- Common ancestry
- Romanian 13% Slovak 1% Iranian 1%
- Foreign-born
- 0%
Political lean MEDSL · Belmont
- 2024 margin
- Solid R (+47.3) · D 26.0% · R 73.3%
- 2008→2024 swing
- -50.0pp toward R · 2008: 2.7pp · 2024: -47.3pp
- All cycles
- 2024: R+47.3 2020: R+43.6 2016: R+39.5 2012: R+8.4 2008: D+2.7
Not yet ingested
- Civics
- —
Market trends
- HPI YoY
- ▼ -27.71%
- Current HPI
- 187.2822
- Rent YoY
- —
- Metro
- —
- State GDP YoY
- ▲ 1.98%
- F500 in state
- 48
Industry mix (Fortune 500 HQ in OH)
| Industry | F500 HQs | Revenue |
|---|---|---|
| Insurance | 3 | $145B |
|
||
| Industrial Machinery | 3 | $49B |
|
||
| Financial Services | 3 | $24B |
|
||
| Consumer Goods | 2 | $93B |
|
||
| Aerospace / Defense | 2 | $47B |
|
||
| Utilities | 2 | $33B |
|
||
Price history
+296.3% since first listed5 events — show timeline
- 2026-06-19 Contingent — MLSNOW
- 2026-04-20 Listed $170,000 MLSNOW
- 2008-12-11 Sold (Public Records) $35,000 Public Records
- 2008-12-01 Sold (MLS) $35,000 MLSNOW
- 2008-11-25 Listed $42,900 MLSNOW
Property tax history
+2.9%/yrLatest (2025): $2,181 · -12.7% YoY. Source: county tax records.
Cash-flow waterfall
monthlySold comps — $/sqft
last 12 mo · ≤1 miLoading sold comps…