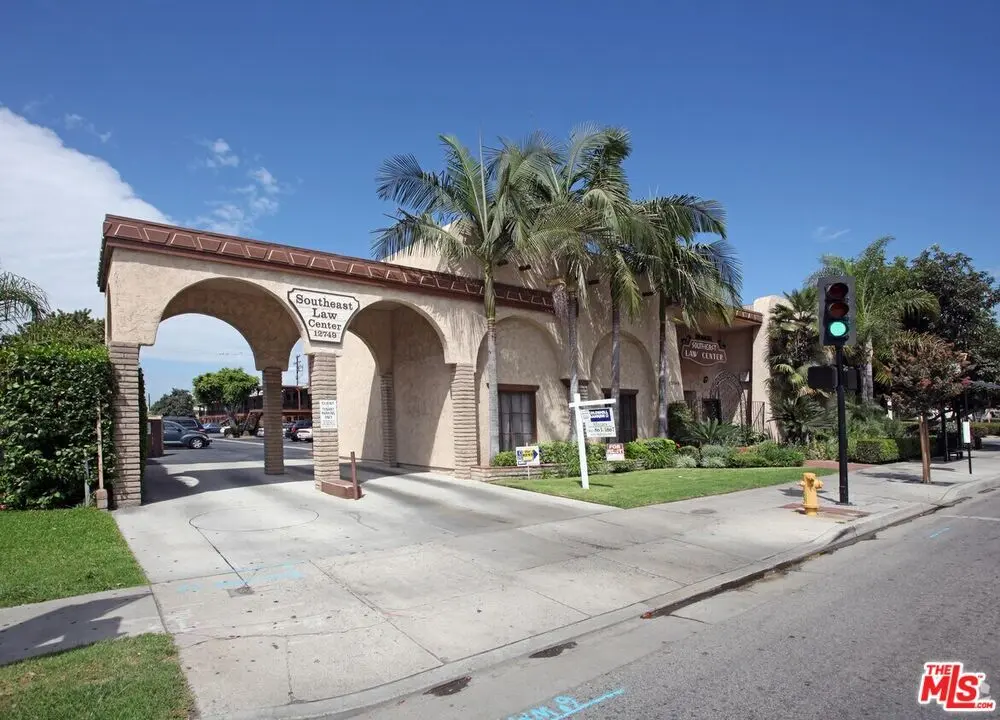
12749 Norwalk Blvd #204
Norwalk, CA 90650
$279,900D-
None bd · 1.0 ba ·
685 sqft ·
Built 1962
· Condo
· Active
· 10 DOM
Cashflow @ list (25.0% down · 7.5%)
Estimated rent
$2,273/mo
Mortgage (P&I)
−$1,468
Tax + insurance
−$466
HOA
−$0
Vac / Maint / Mgmt
−$477
Net cashflow
$-139/mo
Annual
$-1,668/yr
Cap rate
5.70%
Cash-on-cash
-2.13%
DSCR
0.91
1% rule
0.81%
Cash to close
$78,372
Investor read
- This is a ?-bed/1.0-bath condo listed at $280k. Condition is rated good.
- At list price, monthly cash flow is $-139 ($-2k/yr) — negative.
- To cash-flow at today's rent, offer at most $260k (7.2% below list).
- To meet the 1% rule (rent ≥ 1% of price), the offer needs to be $227k (18.8% below list).
- Only 10 days on market — expect competitive offers; lowballing is unlikely to land.
- Recommended offer: $227k (18.8% below list) — sets the bar for 1% rule.
- Local home prices are declining (-3.0%/yr); year-one equity from $2k of loan paydown is wiped out by about $8k of value loss. Plan a longer hold.
- Location reads 68/100 on livability (#282 in CA) — a middle-class / working-renter tenant base. Strengths: commute A+, employment A+, housing B+; Watch: schools D+, crime D+, health & safety D+.
- Norwalk-La Mirada Unified (suburban): math 28% / reading 61% proficiency, ranked #177 of 517 in CA (top 34%) — families likely to look elsewhere, expect single-tenant / working-renter base with shorter leases; 61% free/reduced lunch — lower-income household profile, screen leases tightly.
- Market conditions: Rents rising fast (+4.9%/yr); 72 active listings in the ZIP; 12 comparable units currently listed for rent nearby; rentals at typical pace (median 16d on market — plan ~3-4 weeks tenant-placement turnaround); solid renter incomes; 19,697 units permitted in Los Angeles County in 2024 (9,426 in 5+ unit buildings).
- Los Angeles County population projected at +9% by 2050 — modest demand growth; plan on rents tracking national, not racing it.
- Climate carrying-cost: extreme-heat days projected 7→22/yr by 2055 (HVAC capex compounding) — expect insurance premiums to compound above CPI over the hold.
- Cap rate 5.7% vs local median 2.7% in Norwalk — top-decile yield for the area; either an underpriced asset or a hidden risk that comps aren't pricing in. Stress-test before assuming the spread holds.
Questions for listing agent
- What do current leases actually rent for vs. the listed asking? Can we see a recent rent roll and the last 12 months of T-12 income?
- Built in 1962 — when were the roof, HVAC, electrical panel, plumbing, and water heater last replaced?
- Any open or pending special assessments — roof, HVAC, plumbing, elevator, façade? What's the per-unit balance and payoff schedule, and is the seller paying it off at close or rolling it to the buyer?
- Is there a deadline driving the sale (1031 exchange, divorce, estate, relocation)? That informs how much negotiation room exists.
- Schools are D-rated, which usually means shorter tenancies and higher turnover. Who's the typical renter profile here, and what's been the actual vacancy rate?
- Crime grade is D in this area — have there been break-ins, vandalism, or insurance claims at this property in the last 3 years? What carrier currently insures it and at what premium?
- The area grade is low — what's the realistic commute time and amenity access for the typical tenant pool here? Any planned neighborhood developments (good or bad) we should know about?
- What's the average days-on-market for RENTAL listings here right now (not sales)? A rising rental-DOM trend means longer vacancies and softer asking-rent achievability than the comps imply.
CashFlowRE · CFR-25HJQVC0BM69T5
· Data 2 days ago
cashflowre.app · 2026-05-29