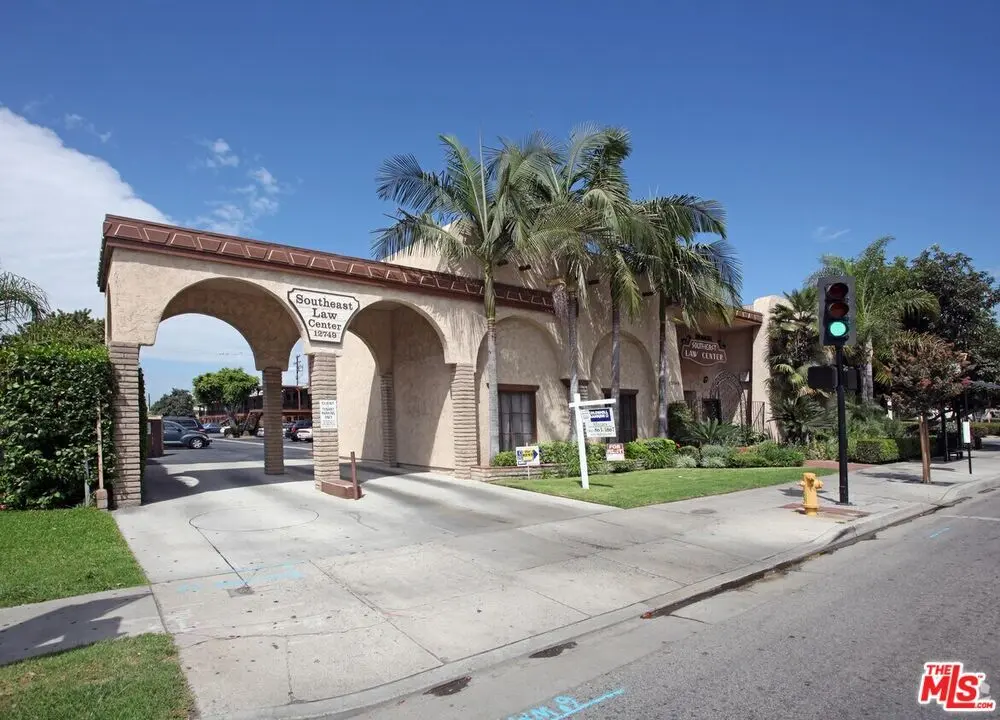
12749 Norwalk Blvd #204 · Norwalk, CA
Flood risk 3/10 · Minor
- FEMA flood zone
- X (unshaded)
- Chance of flooding over 30 yrs
- 0.2%
- Est. flood insurance / yr
- $507 – $1,088
Fire risk 1/10 · Minimal
- Est. fire insurance / yr
- $659 – $1,223
Heat risk 5/10 · Moderate
- Hot days now (above 93°F)
- 7 days/yr
- Hot days in 30 yrs
- 22 days/yr
Wind risk 1/10 · Minimal
- Chance of severe wind over 30 yrs
- —
Air-quality risk 5/10 · Moderate
- Unhealthy air days now
- 7 days/yr
- Unhealthy air days in 30 yrs
- 9 days/yr
Risk factors via First Street. Map © Google.
Why this score? — see what drove the D- grade
The composite is a weighted blend of 9 inputs, each scored 0–100. Each bar is that input's sub-score; the figure is the points it added to the 100-point composite (weight × sub-score).
- Cash flow +10.6/30.0
- ARV discount +7.5/15.0
- Schools +4.0/10.0
- Condition / age +3.8/5.0
- Rent growth +3.7/5.0
- Livability +3.4/5.0
- 1% rule +3.1/10.0
- DSCR +3.1/10.0
- Appreciation +0.0/10.0
$279,900
🖨 Deal sheet 📄 Offer letter ✓ Due diligence
Listing remarks
The Condo has a private restroom, 2 offices, 3 work stations, reception space with storage, 24 hour access, fenced lot, security system, signage, and wheelchair accessible. Owner financing available call (559)978-8410
Key facts
- Reception space
- Security system
- 2 offices
Tags
Property features AI
Finance
- Other: Property is lender owned / REO
- Financial info: Tenant pays: air conditioning/heat maintenance, gas, association dues, electric, cable TV, and insurance; Gross income reported as $0 (multi-unit info); Vacancy rate shown as 1%; Rent example (Unit 1): $1,500 actual/projected
- HOA & community: 15 units in the complex
Exterior
- Parking: Total of 74 parking spaces; No garage
- Security: Smoke detectors; Prewired for alarm system; Alarm system present
- Utilities: Public/district water; Sewer: other
- Home design: Residential income property; Two-level building (2 total floors)
- Construction: Land lease (lease expires 2026)
- Exterior features: Attached buildings (common walls); No additional exterior structures
Interior
- Bedrooms: Unit example: studio/efficiency (0 bedrooms listed for Unit 1)
- Bathrooms: Unit example: 1 bathroom (Unit 1)
- Heating & cooling: Central heating; Air conditioning
- Interior features: Ground-level entry with steps; Office; Additional versatile room (other room); Alarm system and phone system installed; Prewired for alarm system; Smoke detector
Neighborhood map
What this means for you Summary
Snapshot
- This is a ?-bed/1.0-bath condo listed at $280k. Condition is rated good.
Deal economics
- At list price, monthly cash flow is $-139 ($-2k/yr) — negative.
- To cash-flow at today's rent, offer at most $260k (7.2% below list).
- To meet the 1% rule (rent ≥ 1% of price), the offer needs to be $227k (18.8% below list).
- Recommended offer: $227k (18.8% below list) — sets the bar for 1% rule.
- Cap rate 5.7% vs local median 2.7% in Norwalk — top-decile yield for the area; either an underpriced asset or a hidden risk that comps aren't pricing in. Stress-test before assuming the spread holds.
Location & tenants
- Location reads 68/100 on livability (#282 in CA) — a middle-class / working-renter tenant base. Strengths: commute A+, employment A+, housing B+; Watch: schools D+, crime D+, health & safety D+.
- Norwalk-La Mirada Unified (suburban): math 28% / reading 61% proficiency, ranked #177 of 517 in CA (top 34%) — families likely to look elsewhere, expect single-tenant / working-renter base with shorter leases; 61% free/reduced lunch — lower-income household profile, screen leases tightly.
- Market conditions: Rents rising fast (+4.9%/yr); 72 active listings in the ZIP; 12 comparable units currently listed for rent nearby; rentals at typical pace (median 15d on market — plan ~3-4 weeks tenant-placement turnaround); solid renter incomes; 19,697 units permitted in Los Angeles County in 2024 (9,426 in 5+ unit buildings).
Forward outlook
- Local home prices are declining (-3.0%/yr); year-one equity from $2k of loan paydown is wiped out by about $8k of value loss. Plan a longer hold.
- Los Angeles County population projected at +9% by 2050 — modest demand growth; plan on rents tracking national, not racing it.
Negotiation context
- Only 10 days on market — expect competitive offers; lowballing is unlikely to land.
Risks & watch-outs
- Climate carrying-cost: extreme-heat days projected 7→22/yr by 2055 (HVAC capex compounding) — expect insurance premiums to compound above CPI over the hold.
Questions for the listing agent
- What do current leases actually rent for vs. the listed asking? Can we see a recent rent roll and the last 12 months of T-12 income?
- Built in 1962 — when were the roof, HVAC, electrical panel, plumbing, and water heater last replaced?
- Any open or pending special assessments — roof, HVAC, plumbing, elevator, façade? What's the per-unit balance and payoff schedule, and is the seller paying it off at close or rolling it to the buyer?
- Is there a deadline driving the sale (1031 exchange, divorce, estate, relocation)? That informs how much negotiation room exists.
- Schools are D-rated, which usually means shorter tenancies and higher turnover. Who's the typical renter profile here, and what's been the actual vacancy rate?
- Crime grade is D in this area — have there been break-ins, vandalism, or insurance claims at this property in the last 3 years? What carrier currently insures it and at what premium?
- The area grade is low — what's the realistic commute time and amenity access for the typical tenant pool here? Any planned neighborhood developments (good or bad) we should know about?
- What's the average days-on-market for RENTAL listings here right now (not sales)? A rising rental-DOM trend means longer vacancies and softer asking-rent achievability than the comps imply.
- What's the recent tenant-quality profile in this submarket — average credit score on applications, eviction rate, late-payment / NSF rate, and stable-employment percentage? A property-management company in the area should have these aggregated.
- How much new apartment / multifamily construction is in the pipeline within 1–3 miles? Heavy new supply (>2% of stock underway) typically softens rents 12–24 months out; light construction supports rent growth.
Investment metrics
- 1% rule
- 0.81% ✗
- Cap rate
- 5.70%
- Cash-on-cash
- -2.13%
- DSCR
- 0.91
- GRM
- 10.3
CMA / ARV
No comps found within radius.
Projected returns pro-forma
-3.0% appreciation · 4.9% rent growth · sell at horizon
- IRR
- -17.7%
- Equity multiple
- 0.37×
- Total profit
- $-49,748
- Equity at exit
- $41,734
- IRR
- -6.6%
- Equity multiple
- 0.54×
- Total profit
- $-35,696
- Equity at exit
- $24,201
Cash invested: $78,372 (down + closing). Projections, not guarantees.
Landlord ↔ Tenant lean methodology
- Overall (STATE)
- 18 Strongly Tenant-Friendly
- State California
- 18 Strongly Tenant-Friendly · D+13
- County
- — inherits STATE
- City
- — inherits STATE
ZIP-level market 90650
- Rents YoY
- 4.9%
- Active inventory
- 72
- Price-to-rent
- 10.3×
Monthly cashflow live
- Estimated rent
- $2,273 high interval (Pro) →
- Mortgage (P&I)
- −$1,468
- Tax est. 1.5%
- −$350 /mo · $4,198/yr
- Insurance
- −$117
- HOA
- −$0
- Vacancy / Maint / Mgmt
- −$477
- Net cashflow
- $-139
Break-even live
UW: 25.0% down · 7.5% · 30yr · 1.5% tax · 5.0% vac · 8.0% maint · 8.0% mgmt
Financing live
Cash to close
- Down payment
- $69,975
- Closing costs
- $8,397
- Reserves months
- —
- Total cash needed
- —
Loan-product check · same deal, 3 products live
Conventional
25% down · 7.5% · 30yr
- Down + closing
- —
- Monthly P&I
- —
- Monthly cashflow
- —
- DSCR
- —
- Eligible?
- —
Personal DTI + credit; lowest rate.
DSCR
20% down · 8.5% · 30yr
- Down + closing
- —
- Monthly P&I
- —
- Monthly cashflow
- —
- DSCR
- —
- Eligible?
- —
No personal income docs; deal must DSCR.
Hard money
10% down · 12.0% · 12mo
- Down + closing
- —
- Monthly P&I
- —
- Monthly cashflow
- —
- DSCR
- —
- Eligible?
- —
Short-term bridge; refi at stabilization.
Rent comps 12 comps
| Address | Beds | Baths | Sqft | Rent | $/sqft | DOM | Units | Dist |
|---|---|---|---|---|---|---|---|---|
| 12809 Kalnor Ave Norwalk, CA | 1.0 | 1.0 | 640 | $1,925 | $3.01 | 43d | 1 | 0.15mi |
| 12634 Kalnor Ave Unit 13 Norwalk, CA | 2.0 | 1.0 | 700 | $2,600 | $3.71 | 7d | 1 | 0.15mi |
| 12634 Kalnor Ave Norwalk, CA | 1.0 | 1.0 | 700 | $2,095 | $2.99 | 43d | 1 | 0.15mi |
| 12016 Imperial Hwy Norwalk, CA | 1.0 | 1.0 | 525 | $2,050 | $3.90 | 7d | 1 | 0.26mi |
| 11872 Sproul St Apt E Norwalk, CA | 1.0 | 1.0 | 520 | $1,800 | $3.46 | 15d | 1 | 0.40mi |
| 13613 Silverbow Ave Norwalk, CA | 1.0 | 1.0 | 700 | $1,900 | $2.71 | 43d | 1 | 0.53mi |
| 11615 Firestone Blvd Norwalk, CA | 1.0–3.0 | 1.0–2.0 | 880 | $2,650 | $3.01 | 2d | 6 | 0.72mi |
| 13420 Harvest Ave Norwalk, CA | 1.0 | 1.0 | 365 | $1,800 | $4.93 | 7d | 1 | 1.12mi |
| 14339 Flallon Ave Norwalk, CA | 1.0 | 1.0 | 720 | $2,000 | $2.78 | 15d | 1 | 1.15mi |
| 14505 Alburtis Ave Norwalk, CA | 2.0 | 1.0 | 750 | $2,300 | $3.07 | 12d | 1 | 1.21mi |
| 13187 Splendora Ave Unit 13185 Whittier, CA | 1.0 | 1.0 | 450 | $1,650 | $3.67 | 1d | 1 | 1.31mi |
| 13114 Liggett St Norwalk, CA | 1.0 | 1.0 | 499 | $2,200 | $4.41 | 43d | 1 | 1.48mi |
HOA detail condo
- Monthly dues
- $0 · $0/yr
- Likely covers
- security
- Assessments
- None detected in remarks — confirm with the listing agent.
Listing history 8 events
-
2026-06-18days on market $279,900 Active 10 DOM
-
2026-06-17days on market $279,900 Active 9 DOM
-
2026-06-16days on market $279,900 Active 8 DOM
-
2026-06-15days on market $279,900 Active 7 DOM
-
2026-06-13days on market $279,900 Active 5 DOM
-
2026-06-13days on market $279,900 Active 4 DOM
-
2026-06-09remarks 217-char remark
-
2026-06-09$279,900 Active 1 DOM
ⓘ Source: listings_history table (triggers on properties + properties_extension) + one-shot
backfill from property_details.listing_events for pre-trigger history.
Climate risk First Street
- Flood 3/10 Moderate FEMA zone X (unshaded) · 20% chance over 30 yrs
- Wildfire 1/10 Low
- Heat 5/10 Major 7 d/yr ≥93°F today · 22 d/yr by 30 yrs out
- Wind 1/10 Low
- Air quality 5/10 Major 7 unhealthy d/yr today · 9 by 30 yrs out
Nearby sold comps map
Loading sold comps map…
Walkable amenities ~0.75 mi
Loading nearby amenities…
Taxation est. · year 1
- Rental income
- $27,271
- − Mortgage interest
- −$15,679
- − Property taxes
- −$4,198
- − Insurance
- −$1,400
- − Repairs & maintenance
- −$2,182
- − Management
- −$2,182
- − Depreciation
- −$8,143
- Taxable loss
- −$6,512
- Est. tax savings @ 24.0%
- +$1,563
- After-tax cash flow
- $-105/yr
For passive investors: Depreciation is non-cash, so a rental often shows a tax loss while cash-flowing — sheltering income. Rental losses are passive: they offset passive income freely, and up to $25,000/yr can offset ordinary (W-2) income if you actively participate and your MAGI is under $100k (phasing out to $0 by $150k); unused losses carry forward. On sale, claimed depreciation is recaptured at up to 25%, and gains may owe capital-gains tax (a 1031 exchange can defer both). Figures are a year-1 estimate at your 24.0% rate — not tax advice; consult a CPA.
Condition & rehab AI · 13 photos
The property is in good condition with minimal repairs needed. Painting the exterior and maintaining the common areas can significantly increase its value.
Value-add opportunities
- Both Paint the exterior walls — Fresh paint can enhance the curb appeal and increase both resale and rental value.
- Both Clean the common areas — A clean and well-maintained common area can attract more tenants and buyers.
- Both Inspect and clean the HVAC system — A clean and functioning HVAC system can improve comfort and reduce energy costs.
Renovation cost estimate screening
Value-add ROI direction
- Both Paint the exterior walls — Fresh paint can enhance the curb appeal and increase both resale and rental value. ↑
- Both Clean the common areas — A clean and well-maintained common area can attract more tenants and buyers. ↑
- Both Inspect and clean the HVAC system — A clean and functioning HVAC system can improve comfort and reduce energy costs. ↑
ⓘ Cost ranges are severity-bucket heuristics (US national rule-of-thumb). Get contractor quotes + a written scope before underwriting a rehab budget.
Schools (NCES district)
- District
- Norwalk-La Mirada Unified
- NCES district ID
- 0627690
- Math proficiency
- 28% ▼ -7.00%
- Reading proficiency
- 61% ▲ 14.00%
- Median HH income
- $65,950
- Composite
- 39.62/100
- National rank
- #3919
- State rank
- #177 of 517 in CA
Livability — Norwalk
- Score
- 68/100
- State rank
- #282
- US rank
- #9427
Category grades
Schools grade is shown separately in the Schools card above.
Census & demographics
- Census place
- Norwalk, CA
- County
- Los Angeles County · 9,444,647 people
- City population
- 99,900
- Metro
- Los Angeles-Long Beach-Anaheim, CA
- Population (ZIP)
- 99,900
- Household income
- $100,085
- Rent vs Own
- Severe rent burden
- 2608.0
Population outlook (Los Angeles County) Hauer SSP2
- Today (2025)
- 10,940,515 people
- By 2030
- 11,256,481 · +2.9%
- By 2040
- 11,729,929 · +7.2%
- By 2050
- 11,948,407 · +9.2%
- By 2075
- 11,818,114 · +8.0%
- By 2100
- 10,842,928 · -0.9%
Race, ethnicity, and origin ACS 2023
- Neighborhood character
- Predominantly Hispanic (69%)
- Race & ethnicity
- Hispanic / Latino 69% Two or more races 17% Asian 13% White 11% Black 4% Native American 2%
- Hispanic origin (detail)
- Mexican 59%
- Foreign-born
- 33% · Canada, South Korea, Vietnam
- Languages at home
- 37% English-only · Spanish 51% Tagalog/Filipino 5% Other Asian/Pacific 2%
Political lean MEDSL · Los Angeles
- 2024 margin
- Solid D (+32.9) · D 64.8% · R 31.9% · Other 3.3%
- 2008→2024 swing
- -7.4pp toward R · 2008: 40.4pp · 2024: 32.9pp
- All cycles
- 2024: D+32.9 2020: D+44.2 2016: D+48.0 2012: D+40.0 2008: D+40.4
Not yet ingested
- Civics
- —
Market trends
- HPI YoY
- ▼ -1018.98%
- Current HPI
- 444.1097
- Rent YoY
- ▲ 4.90%
- Metro
- Los Angeles-Long Beach-Anaheim, CA
- State GDP YoY
- ▲ 3.21%
- F500 in state
- 116
Industry mix (Fortune 500 HQ in CA)
| Industry | F500 HQs | Revenue |
|---|---|---|
| Technology | 27 | $1,492B |
|
||
| Financial Services | 3 | $174B |
|
||
| Retail | 3 | $44B |
|
||
| Insurance | 3 | $26B |
|
||
| Media / Entertainment | 2 | $115B |
|
||
| Pharmaceuticals / Biotech | 2 | $62B |
|
||
Price history
1 event — show timeline
- 2026-06-05 Listed $279,900 TheMLS
Cash-flow waterfall
monthlySold comps — $/sqft
last 12 mo · ≤1 miLoading sold comps…