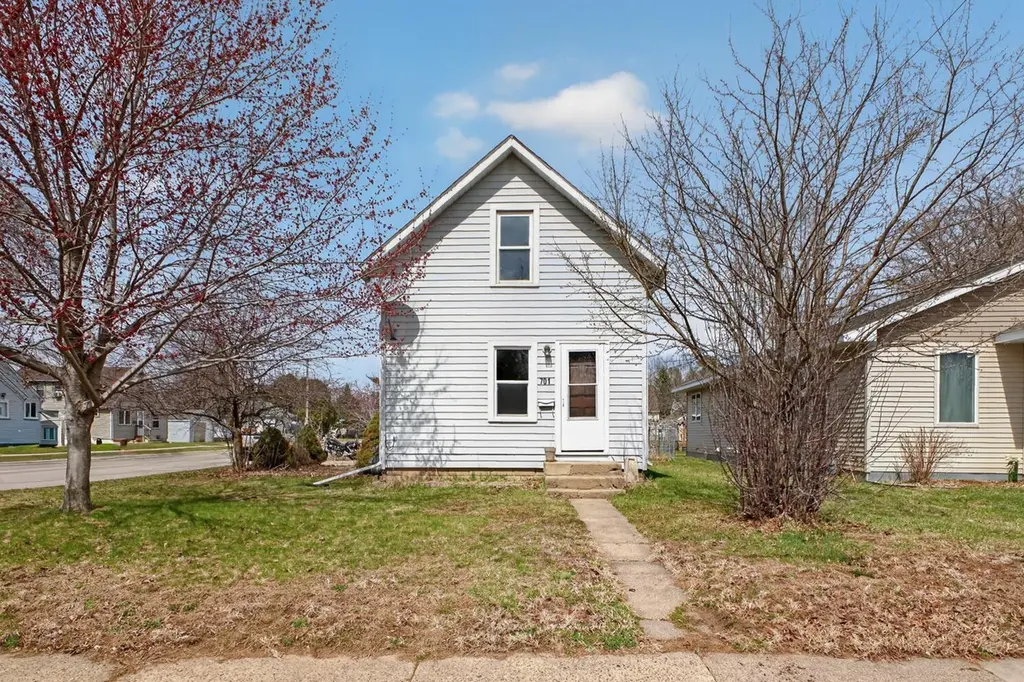
701 10th Ave SE
Austin, MN 55912
$92,000B-
1 bd · 1.0 ba ·
598 sqft ·
Built 1937
· SingleFamily
· Pending
· 30 DOM
Cashflow @ list (25.0% down · 7.5%)
Estimated rent
$1,082/mo
Mortgage (P&I)
−$482
Tax + insurance
−$102
HOA
−$0
Vac / Maint / Mgmt
−$227
Net cashflow
$271/mo
Annual
$3,247/yr
Cap rate
9.82%
Cash-on-cash
12.61%
DSCR
1.56
1% rule
1.18%
Cash to close
$25,760
Investor read
- This is a 1-bed/1.0-bath single-family listed at $92k.
- At list price, monthly cash flow is $271 ($3k/yr) — positive.
- The deal already cash-flows at list — no discount required.
- Meets the 1% rule at list price ($1k rent vs $92k).
- It's been on market 30 days — a 2% lower offer ($91k) is reasonable based on typical stale-listing flexibility.
- Recommended offer: $91k (1.5% below list) — sets the bar for market timing.
- Local home prices are declining (-3.0%/yr); year-one equity from $636 of loan paydown is wiped out by about $3k of value loss. Plan a longer hold.
- Location reads 80/100 on livability (#77 in MN, #1,829 nationally) — a professional / high-income tenant draw. Strengths: cost of living A+, housing A+, health & safety A+; Watch: commute F.
- Austin Public School District (town): math 24% / reading 34% proficiency, ranked #267 of 301 in MN (top 89%) — low school quality limits family demand, transient renter base, plan for 1-2y turnover.
- Zoned schools: Southgate Elementary (math 48% / reading 41%, grade F, #534 of 857 statewide, top 66%, 496 students, 64% FRL); I.J. Holton Intermediate School (math 19% / reading 41%, grade F, #199 of 258 statewide, top 78%, 741 students, 68% FRL); Austin Senior High (math 32% / reading 44%, grade F, #278 of 471 statewide, top 59%, 1,345 students, 60% FRL) — zoned schools average 64% FRL vs 46% district-wide (18 pts higher); higher-poverty schools than district average — tighter screening recommended.
- Watch-outs: built in 1937 — expect roof / HVAC / electrical / plumbing capex.
- Market conditions: Rents rising fast (+11.6%/yr); 196 active listings in the ZIP; 3 comparable units currently listed for rent nearby; rentals lingering (median 46d on market — plan ~5-8 weeks vacancy on turnover, expect pricing pressure); 100% of comp listings sitting > 30 days — soft ceiling on asking rent; 53 units permitted in Mower County in 2024 (0 in 5+ unit buildings).
- 11 sale attempts since 27y ago with the ask held roughly flat each time — persistent listings suggest the price (not the market) is what's stuck; bring a comps-based counter.
- Current owner paid $54k; list at $92k implies a 69% gain — meaningful room to come down on a strong offer.
- At projected returns (-3.0% appreciation + 8.0% rent growth), your $26k cash investment doubles in ~7 years — after that, you're playing with house money.
- Cap rate 9.8% vs local median 4.5% in Austin — top-decile yield for the area; either an underpriced asset or a hidden risk that comps aren't pricing in. Stress-test before assuming the spread holds.
Questions for listing agent
- Built in 1937 — when were the roof, HVAC, electrical panel, plumbing, and water heater last replaced?
- Is there a deadline driving the sale (1031 exchange, divorce, estate, relocation)? That informs how much negotiation room exists.
- What's the average days-on-market for RENTAL listings here right now (not sales)? A rising rental-DOM trend means longer vacancies and softer asking-rent achievability than the comps imply.
- What's the recent tenant-quality profile in this submarket — average credit score on applications, eviction rate, late-payment / NSF rate, and stable-employment percentage? A property-management company in the area should have these aggregated.
- How much new for-sale + rental construction is in the pipeline within 1–3 miles? Heavy new supply typically softens prices + rents 12–24 months out; constrained supply supports both.
CashFlowRE · CFR-27RF8TBKMT54CY
· Data 3 weeks ago
cashflowre.app · 2026-05-29