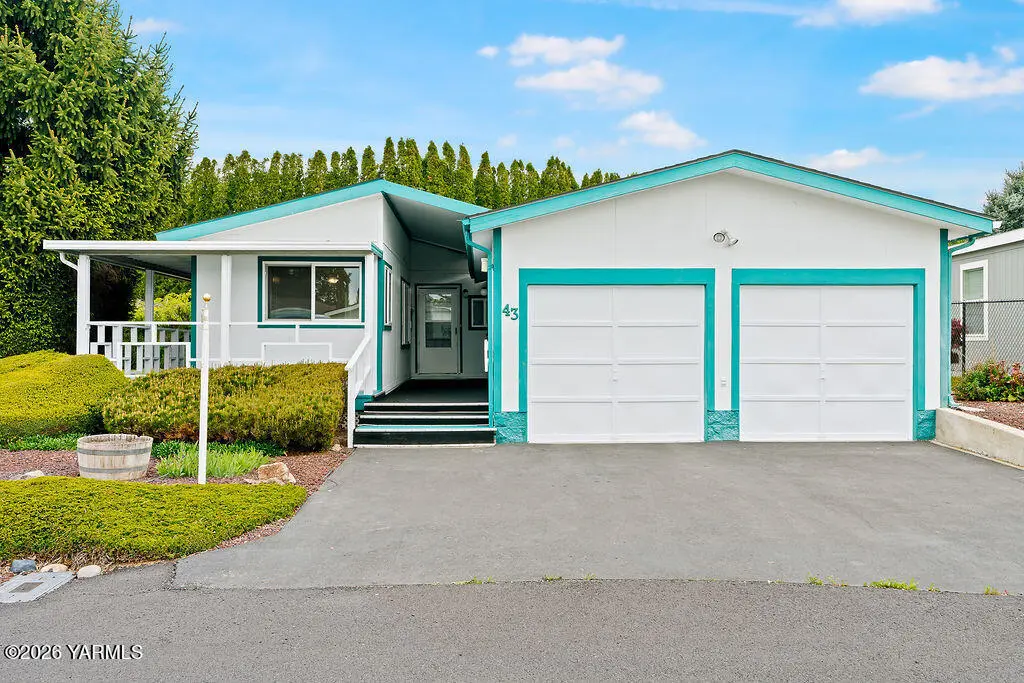
3701 Gun Club Rd #43
Terrace Heights, WA 98901
$170,000C+
3 bd · 2.5 ba ·
1,680 sqft ·
Built 1980
· Manufactured
· Pending
· 40 DOM
Cashflow @ list (25.0% down · 7.5%)
Estimated rent
$1,680/mo
Mortgage (P&I)
−$891
Tax + insurance
−$283
HOA
−$0
Vac / Maint / Mgmt
−$353
Net cashflow
$152/mo
Annual
$1,824/yr
Cap rate
7.37%
Cash-on-cash
3.83%
DSCR
1.17
1% rule
0.99%
Cash to close
$47,600
Investor read
- This is a 3-bed/2.5-bath manufactured listed at $170k. Condition is rated good.
- At list price, monthly cash flow is $152 ($2k/yr) — positive.
- The deal already cash-flows at list — no discount required.
- To meet the 1% rule (rent ≥ 1% of price), the offer needs to be $168k (1.2% below list).
- It's been on market 40 days — a 3% lower offer ($165k) is reasonable based on typical stale-listing flexibility.
- Recommended offer: $165k (3.0% below list) — sets the bar for market timing.
- Local home prices are declining (-3.0%/yr); year-one equity from $1k of loan paydown is wiped out by about $5k of value loss. Plan a longer hold.
- Location reads 72/100 on livability (#210 in WA) — a middle-class / working-renter tenant base. Strengths: housing A+, health & safety A+, employment A; Watch: schools D, amenities F, commute F.
- East Valley School District (Yakima) (suburban): math 54% / reading 61% proficiency, ranked #76 of 291 in WA (top 26%) — acceptable for families but not a draw, mixed tenant base, ~2y average lease.
- Market conditions: Rents rising fast (+9.3%/yr); 168 active listings in the ZIP; 1 comparable units currently listed for rent nearby; 468 units permitted in Yakima County in 2024 (23 in 5+ unit buildings).
- Yakima County population projected at +6% by 2050 — modest demand growth; plan on rents tracking national, not racing it.
- 6 sale attempts; this cycle's ask has dropped $25k (13%) from the opening price — seller is motivated, your offer sets the floor, not the list.
- At projected returns (-3.0% appreciation + 8.0% rent growth), your $48k cash investment doubles in ~10 years — after that, you're playing with house money.
- Climate carrying-cost: major flood risk; major wildfire risk — expect insurance premiums to compound above CPI over the hold.
- Cap rate 7.4% vs local median 2.7% in Terrace Heights — top-decile yield for the area; either an underpriced asset or a hidden risk that comps aren't pricing in. Stress-test before assuming the spread holds.
- This rent runs 35% of the median local income ($57k/yr) — at the standard rent-burdened threshold; future hikes will face affordability resistance.
Questions for listing agent
- It's been on market 40 days. Have you received any prior offers? Is the seller open to a 3% concession, seller financing, or rate buy-down credit?
- Is there a deadline driving the sale (1031 exchange, divorce, estate, relocation)? That informs how much negotiation room exists.
- Schools are D-rated, which usually means shorter tenancies and higher turnover. Who's the typical renter profile here, and what's been the actual vacancy rate?
- What's the average days-on-market for RENTAL listings here right now (not sales)? A rising rental-DOM trend means longer vacancies and softer asking-rent achievability than the comps imply.
- What's the recent tenant-quality profile in this submarket — average credit score on applications, eviction rate, late-payment / NSF rate, and stable-employment percentage? A property-management company in the area should have these aggregated.
- How much new for-sale + rental construction is in the pipeline within 1–3 miles? Heavy new supply typically softens prices + rents 12–24 months out; constrained supply supports both.
CashFlowRE · CFR-28C6MN5WVRAP1E
· Data 3 days ago
cashflowre.app · 2026-05-29