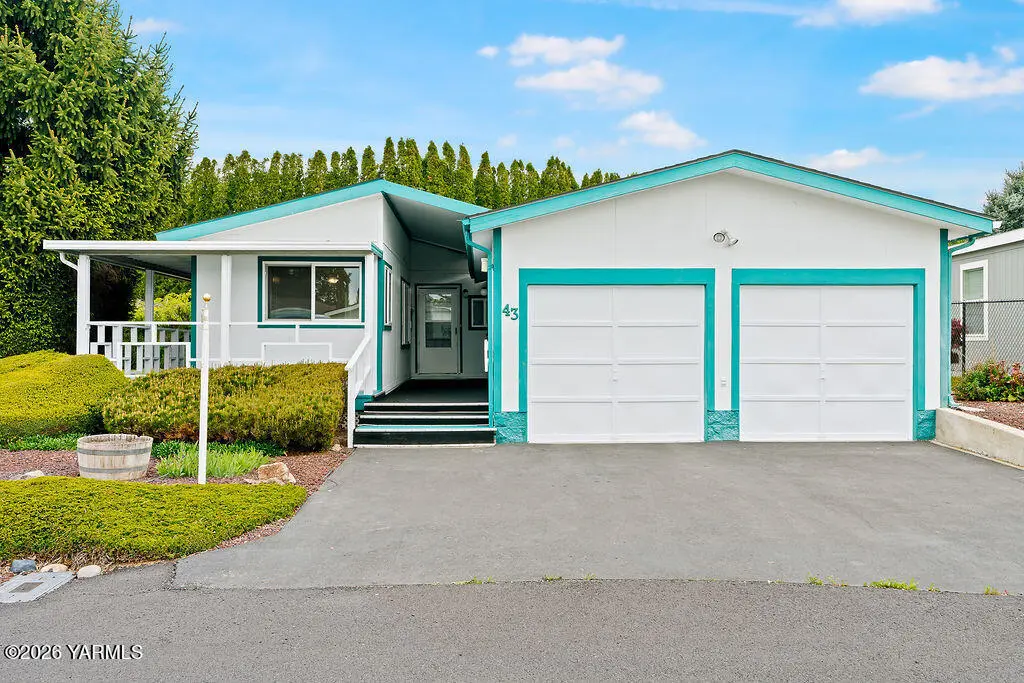
3701 Gun Club Rd #43 · Terrace Heights, WA
Flood risk 6/10 · Moderate
- FEMA flood zone
- X
- Chance of flooding over 30 yrs
- 0.27%
- Est. flood insurance / yr
- $507 – $1,088
Fire risk 6/10 · Moderate
- Est. fire insurance / yr
- $604 – $1,122
Heat risk 4/10 · Minor
- Hot days now (above 97°F)
- 7 days/yr
- Hot days in 30 yrs
- 15 days/yr
Wind risk 1/10 · Minimal
- Chance of severe wind over 30 yrs
- —
Air-quality risk 9/10 · Severe
- Unhealthy air days now
- 15 days/yr
- Unhealthy air days in 30 yrs
- 16 days/yr
Risk factors via First Street. Map © Google.
Why this score? — see what drove the C+ grade
The composite is a weighted blend of 9 inputs, each scored 0–100. Each bar is that input's sub-score; the figure is the points it added to the 100-point composite (weight × sub-score).
- Cash flow +18.2/30.0
- ARV discount +15.0/15.0
- DSCR +5.7/10.0
- Schools +5.1/10.0
- 1% rule +4.9/10.0
- Rent growth +4.8/5.0
- Condition / age +3.8/5.0
- Livability +3.6/5.0
- Appreciation +0.0/10.0
$170,000
🖨 Deal sheet 📄 Offer letter ✓ Due diligence
Listing remarks
This well-maintained Manufactured home offers the rare advantage of park living with lot ownership, combining convenience and long-term value. The home features fresh interior paint, durable wood siding, vinyl windows, and updated PEX plumbing for peace of mind. Inside, you'll find a spacious layout with a large primary suite complete with an ensuite bath, a cozy propane fireplace in the living area, and fresh interior paint throughout. 3 bedrooms and 2.5 baths. 1680 sq ft in total. Two sliding glass doors provide abundant natural light and easy access to a generous deck--perfect for entertaining. The versatile third bedroom has previously been used as a business space and includes its own
Key facts
- 6,970 sq ft lot
- 2 garage spots
- Built 1980
Property features AI
Finance
- Other: Zoned R3 (Multi-family residential)
- HOA & community: Senior community
Exterior
- Parking: Detached 2-car garage
- Utilities: Public water; Sewer connected
- Home design: Manufactured home on land; Single-story; Residential property
- Construction: Wood siding
- Exterior features: Garden; Composition roof
Interior
- Kitchen: Dishwasher; Range; Double oven; Refrigerator
- Flooring: Carpet; Vinyl
- Bathrooms: 2 full bathrooms; 1 half bathroom
- Heating & cooling: Central air conditioning; Electric heating; Forced air; Propane heating
- Interior features: Gas fireplace; Water softener; Crawl space
Neighborhood map
What this means for you Summary
Snapshot
- This is a 3-bed/2.5-bath manufactured listed at $170k. Condition is rated good.
Deal economics
- At list price, monthly cash flow is $152 ($2k/yr) — positive.
- The deal already cash-flows at list — no discount required.
- To meet the 1% rule (rent ≥ 1% of price), the offer needs to be $168k (1.2% below list).
- Recommended offer: $165k (3.0% below list) — sets the bar for market timing.
- Cap rate 7.4% vs local median 2.7% in Terrace Heights — top-decile yield for the area; either an underpriced asset or a hidden risk that comps aren't pricing in. Stress-test before assuming the spread holds.
Location & tenants
- Location reads 72/100 on livability (#210 in WA) — a middle-class / working-renter tenant base. Strengths: housing A+, health & safety A+, employment A; Watch: schools D, amenities F, commute F.
- East Valley School District (Yakima) (suburban): math 54% / reading 61% proficiency, ranked #76 of 291 in WA (top 26%) — acceptable for families but not a draw, mixed tenant base, ~2y average lease.
- Market conditions: Rents rising fast (+9.3%/yr); 168 active listings in the ZIP; 1 comparable units currently listed for rent nearby; 468 units permitted in Yakima County in 2024 (23 in 5+ unit buildings).
- This rent runs 35% of the median local income ($57k/yr) — at the standard rent-burdened threshold; future hikes will face affordability resistance.
Forward outlook
- Local home prices are declining (-3.0%/yr); year-one equity from $1k of loan paydown is wiped out by about $5k of value loss. Plan a longer hold.
- Yakima County population projected at +6% by 2050 — modest demand growth; plan on rents tracking national, not racing it.
- At projected returns (-3.0% appreciation + 8.0% rent growth), your $48k cash investment doubles in ~10 years — after that, you're playing with house money.
Negotiation context
- It's been on market 40 days — a 3% lower offer ($165k) is reasonable based on typical stale-listing flexibility.
- 6 sale attempts; this cycle's ask has dropped $25k (13%) from the opening price — seller is motivated, your offer sets the floor, not the list.
Risks & watch-outs
- Climate carrying-cost: major flood risk; major wildfire risk — expect insurance premiums to compound above CPI over the hold.
Questions for the listing agent
- It's been on market 40 days. Have you received any prior offers? Is the seller open to a 3% concession, seller financing, or rate buy-down credit?
- Is there a deadline driving the sale (1031 exchange, divorce, estate, relocation)? That informs how much negotiation room exists.
- Schools are D-rated, which usually means shorter tenancies and higher turnover. Who's the typical renter profile here, and what's been the actual vacancy rate?
- What's the average days-on-market for RENTAL listings here right now (not sales)? A rising rental-DOM trend means longer vacancies and softer asking-rent achievability than the comps imply.
- What's the recent tenant-quality profile in this submarket — average credit score on applications, eviction rate, late-payment / NSF rate, and stable-employment percentage? A property-management company in the area should have these aggregated.
- How much new for-sale + rental construction is in the pipeline within 1–3 miles? Heavy new supply typically softens prices + rents 12–24 months out; constrained supply supports both.
Investment metrics
- 1% rule
- 0.99% ✗
- Cap rate
- 7.37%
- Cash-on-cash
- 3.83%
- DSCR
- 1.17
- GRM
- 8.4
CMA / ARV
- ARV (median comp)
- $249,505
- List price
- $170,000
- Delta
- -31.87%
- Verdict
- UNDERPRICED
- Comps
- 12 within 1.0 mi
Show comp detail 12 sales within ~0.75 mi
| Address | Dist | Beds/Ba | Sqft | Sold | Price | $/sf | Match |
|---|---|---|---|---|---|---|---|
| 3701 Gun Club Rd Ave #68 | 0.08mi | 3/2.0 | 1,674 (-0%) | 1mo | $175,000 | $105 | 92 |
| 3701 Gun Club Rd #69 | 0.09mi | 3/2.0 | 1,620 (-4%) | 2mo | $230,000 | $142 | 86 |
| 3701 Gun Club Rd #64 | 0.26mi | 3/2.0 | 1,744 (+4%) | 1mo | $288,000 | $165 | 79 |
| 3701 Gun Club Rd #71 | 0.00mi | 3/2.0 | 1,512 (-10%) | 7mo | $218,500 | $145 | 75 |
| 3701 Gun Club Rd #60 | 0.12mi | 3/2.0 | 1,848 (+10%) | 5mo | $308,000 | $167 | 72 |
| 3701 Gun Club Rd #113 | 0.26mi | 3/2.0 | 1,819 (+8%) | 1mo | $265,000 | $146 | 72 |
| 3701 Gun Club Rd #120 | 0.26mi | 3/2.0 | 1,507 (-10%) | 1mo | $250,000 | $166 | 68 |
| 3701 Gun Club Rd #115 | 0.21mi | 3/2.0 | 1,512 (-10%) | 7mo | $314,900 | $208 | 66 |
| 3701 Gun Club Rd #25 | 0.12mi | 3/2.0 | 1,466 (-13%) | 8mo | $130,000 | $89 | 65 |
| 3701 Gun Club Rd #48 | 0.26mi | 3/2.0 | 1,512 (-10%) | 6mo | $248,000 | $164 | 64 |
| 3701 Gun Club Rd #33 | 0.11mi | 3/2.0 | 1,440 (-14%) | 7mo | $237,500 | $165 | 64 |
| 3701 Gun Club Rd #20 | 0.12mi | 2/2.0 (-1) | 1,440 (-14%) | 12mo | $219,500 | $152 | 53 |
Match score weights: distance 35% · size 25% · config 20% · recency 20%. Top-matched comps best support the ARV.
Projected returns pro-forma
-3.0% appreciation · 8.0% rent growth · sell at horizon
- IRR
- -4.8%
- Equity multiple
- 0.81×
- Total profit
- $-8,962
- Equity at exit
- $25,348
- IRR
- 10.0%
- Equity multiple
- 1.95×
- Total profit
- $45,167
- Equity at exit
- $14,698
Cash invested: $47,600 (down + closing). Projections, not guarantees.
Landlord ↔ Tenant lean methodology
- Overall (STATE)
- 28 Tenant-Leaning
- State Washington
- 28 Tenant-Leaning · D+8
- County
- — inherits STATE
- City
- — inherits STATE
ZIP-level market 98901
- Home prices YoY
- -33.4%
- Rents YoY
- 9.3%
- Active inventory
- 168
- Price-to-rent
- 8.4×
Monthly cashflow live
- Estimated rent
- $1,680 medium interval (Pro) →
- Mortgage (P&I)
- −$891
- Tax est. 1.5%
- −$212 /mo · $2,550/yr
- Insurance
- −$71
- HOA
- −$0
- Vacancy / Maint / Mgmt
- −$353
- Net cashflow
- $152
Break-even live
UW: 25.0% down · 7.5% · 30yr · 1.5% tax · 5.0% vac · 8.0% maint · 8.0% mgmt
Financing live
Cash to close
- Down payment
- $42,500
- Closing costs
- $5,100
- Reserves months
- —
- Total cash needed
- —
Loan-product check · same deal, 3 products live
Conventional
25% down · 7.5% · 30yr
- Down + closing
- —
- Monthly P&I
- —
- Monthly cashflow
- —
- DSCR
- —
- Eligible?
- —
Personal DTI + credit; lowest rate.
DSCR
20% down · 8.5% · 30yr
- Down + closing
- —
- Monthly P&I
- —
- Monthly cashflow
- —
- DSCR
- —
- Eligible?
- —
No personal income docs; deal must DSCR.
Hard money
10% down · 12.0% · 12mo
- Down + closing
- —
- Monthly P&I
- —
- Monthly cashflow
- —
- DSCR
- —
- Eligible?
- —
Short-term bridge; refi at stabilization.
Rent comps 1 comps
| Address | Beds | Baths | Sqft | Rent | $/sqft | DOM | Units | Dist |
|---|---|---|---|---|---|---|---|---|
| 5303 N Sky Vista Ave Yakima, WA | 3.0 | 2.0 | 1512 | $2,150 | $1.42 | 13d | 1 | 1.38mi |
Listing history 25 events
-
2026-06-17status $170,000 Pending 40 DOM
-
2026-06-16days on market $170,000 Active 40 DOM
-
2026-06-15days on market $170,000 Active 39 DOM
-
2026-06-14days on market $170,000 Active 37 DOM
-
2026-06-13days on market $170,000 Active 36 DOM
-
2026-06-10days on market $170,000 Active 34 DOM
-
2026-06-09days on market $170,000 Active 33 DOM
-
2026-06-08days on market $170,000 Active 32 DOM
-
2026-06-07pricestatusdays on market $170,000 Active 31 DOM
-
2026-04-29$194,900 Active 1184-char remark
-
2026-04-07status Active
-
2026-03-17price $195,999
-
2026-03-03price $204,999
-
2026-02-04status Active
-
2026-01-13status Pending
-
2026-01-06price $214,999
-
2025-12-19price $217,000
-
2025-12-02price $219,000
-
2025-11-25price $227,500
-
2025-11-07$229,000 Active
-
2025-08-27price $235,000
-
2025-08-11price $245,000
-
2025-07-13price $249,000
-
2025-06-28price $259,000
-
2025-06-03$265,000 Active
ⓘ Source: listings_history table (triggers on properties + properties_extension) + one-shot
backfill from property_details.listing_events for pre-trigger history.
Climate risk First Street
- Flood 6/10 Major FEMA zone X · 27% chance over 30 yrs
- Wildfire 6/10 Major
- Heat 4/10 Moderate 7 d/yr ≥97°F today · 15 d/yr by 30 yrs out
- Wind 1/10 Low
- Air quality 9/10 Extreme 15 unhealthy d/yr today · 16 by 30 yrs out
Nearby sold comps map
Loading sold comps map…
Walkable amenities ~0.75 mi
Loading nearby amenities…
Taxation est. · year 1
- Rental income
- $20,155
- − Mortgage interest
- −$9,523
- − Property taxes
- −$2,550
- − Insurance
- −$850
- − Repairs & maintenance
- −$1,612
- − Management
- −$1,612
- − Depreciation
- −$4,945
- Taxable loss
- −$938
- Est. tax savings @ 24.0%
- +$225
- After-tax cash flow
- $2,050/yr
For passive investors: Depreciation is non-cash, so a rental often shows a tax loss while cash-flowing — sheltering income. Rental losses are passive: they offset passive income freely, and up to $25,000/yr can offset ordinary (W-2) income if you actively participate and your MAGI is under $100k (phasing out to $0 by $150k); unused losses carry forward. On sale, claimed depreciation is recaptured at up to 25%, and gains may owe capital-gains tax (a 1031 exchange can defer both). Figures are a year-1 estimate at your 24.0% rate — not tax advice; consult a CPA.
Condition & rehab AI · 12 photos
This well-maintained manufactured home offers a good condition with fresh paint and updated features. It has a good curb appeal and is ready for minor cosmetic updates to enhance its resale and rental value.
Value-add opportunities
- Both Paint the exterior trim and siding — Enhances curb appeal and value
- Both Replace carpet with hardwood or tile flooring — Improves aesthetics and increases value
- Both Update countertops and backsplash in bathrooms — Modernizes the space and adds value
Renovation cost estimate screening
Value-add ROI direction
- Both Paint the exterior trim and siding — Enhances curb appeal and value ↑
- Both Replace carpet with hardwood or tile flooring — Improves aesthetics and increases value ↑
- Both Update countertops and backsplash in bathrooms — Modernizes the space and adds value ↑
ⓘ Cost ranges are severity-bucket heuristics (US national rule-of-thumb). Get contractor quotes + a written scope before underwriting a rehab budget.
Schools (NCES district)
- District
- East Valley School District (Yakima)
- NCES district ID
- 5305370
- Math proficiency
- 54% ▲ 1.00%
- Reading proficiency
- 61% ▲ 5.00%
- Median HH income
- $57,936
- Composite
- 51.46/100
- National rank
- #3682
- State rank
- #76 of 291 in WA
Livability — Terrace Heights
- Score
- 72/100
- State rank
- #210
- US rank
- #5906
Category grades
Schools grade is shown separately in the Schools card above.
Census & demographics
- Census place
- Terrace Heights, WA
- County
- Yakima County · 134,789 people
- Metro
- Yakima, WA
- Population (ZIP)
- 31,366
- Household income
- $57,392
- Rent vs Own
- Severe rent burden
- 1317.0
Population outlook (Yakima County) Hauer SSP2
- Today (2025)
- 256,514 people
- By 2030
- 259,403 · +1.1%
- By 2040
- 265,677 · +3.6%
- By 2050
- 273,061 · +6.5%
- By 2075
- 296,991 · +15.8%
- By 2100
- 315,291 · +22.9%
Race, ethnicity, and origin ACS 2023
- Neighborhood character
- Majority Hispanic (54%)
- Race & ethnicity
- Hispanic / Latino 54% White 39% Two or more races 22% Native American 3% Black 1%
- Hispanic origin (detail)
- Mexican 49%
- Common ancestry
- Italian 3% Lithuanian 2% Scottish 1%
- Foreign-born
- 20% · Canada
- Languages at home
- 53% English-only · Spanish 46%
Political lean MEDSL · Yakima
- 2024 margin
- R (+14.3) · D 41.6% · R 55.9% · Other 2.5%
- 2008→2024 swing
- -3.8pp toward R · 2008: -10.6pp · 2024: -14.3pp
- All cycles
- 2024: R+14.3 2020: R+7.7 2016: R+15.4 2012: R+15.1 2008: R+10.6
Not yet ingested
- Civics
- —
Market trends
- HPI YoY
- ▼ -144.24%
- Current HPI
- 287.8283
- Rent YoY
- ▲ 9.31%
- Metro
- Yakima, WA
- State GDP YoY
- ▲ 4.65%
- F500 in state
- 22
Industry mix (Fortune 500 HQ in WA)
| Industry | F500 HQs | Revenue |
|---|---|---|
| Retail | 2 | $269B |
|
||
| Technology / Retail | 1 | $638B |
|
||
| Technology | 1 | $245B |
|
||
| Telecommunications | 1 | $38B |
|
||
| Food / Beverage | 1 | $36B |
|
||
| Automotive / Trucks | 1 | $34B |
|
||
Price history
-35.8% since first listed21 events — show timeline
- 2026-06-16 Pending — YAMLS
- 2026-06-05 Price Changed $170,000 YAMLS
- 2026-06-05 Relisted — YAMLS
- 2026-05-28 Pending — YAMLS
- 2026-05-19 Price Changed $175,000 YAMLS
- 2026-04-29 Listed $194,900 YAMLS
- 2026-04-07 Relisted — YAMLS
- 2026-03-17 Price Changed $195,999 YAMLS
- 2026-03-03 Price Changed $204,999 YAMLS
- 2026-02-04 Relisted — YAMLS
- 2026-01-13 Pending — YAMLS
- 2026-01-06 Price Changed $214,999 YAMLS
- 2025-12-19 Price Changed $217,000 YAMLS
- 2025-12-02 Price Changed $219,000 YAMLS
- 2025-11-25 Price Changed $227,500 YAMLS
- 2025-11-07 Listed $229,000 YAMLS
- 2025-08-27 Price Changed $235,000 YAMLS
- 2025-08-11 Price Changed $245,000 YAMLS
- 2025-07-13 Price Changed $249,000 YAMLS
- 2025-06-28 Price Changed $259,000 YAMLS
- 2025-06-03 Listed $265,000 YAMLS
Cash-flow waterfall
monthlySold comps — $/sqft
last 12 mo · ≤1 miLoading sold comps…