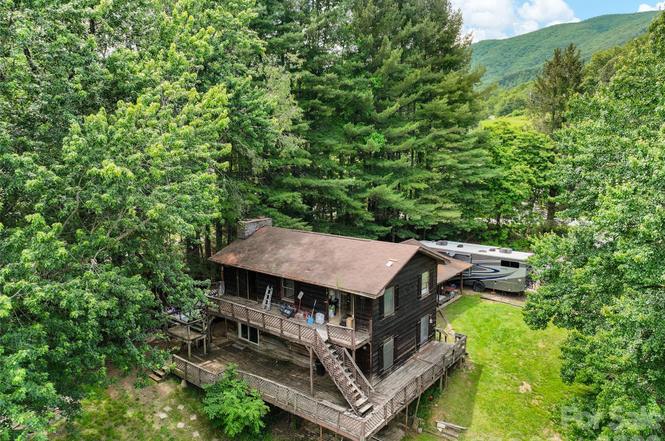
277 Orion Davis Rd
Waynesville, NC 28786
$249,900D
7 bd · 5.0 ba ·
782 sqft ·
Built 1978
· MultiFamily
· Active
· 8 DOM
Cashflow @ list (25.0% down · 7.5%)
Estimated rent
$1,962/mo
Mortgage (P&I)
−$1,311
Tax + insurance
−$303
HOA
−$0
Vac / Maint / Mgmt
−$412
Net cashflow
$-64/mo
Annual
$-762/yr
Cap rate
6.31%
Cash-on-cash
0.05%
DSCR
1.00
1% rule
0.79%
Cash to close
$69,972
Investor read
- This is a 7-bed/5.0-bath multifamily listed at $250k.
- At list price, monthly cash flow is $-64 ($-762/yr) — negative.
- To cash-flow at today's rent, offer at most $239k (4.5% below list).
- To meet the 1% rule (rent ≥ 1% of price), the offer needs to be $196k (21.5% below list).
- Only 8 days on market — expect competitive offers; lowballing is unlikely to land.
- Recommended offer: $196k (21.5% below list) — sets the bar for 1% rule.
- Local home prices are declining (-3.0%/yr); year-one equity from $2k of loan paydown is wiped out by about $7k of value loss. Plan a longer hold.
- Location reads 67/100 on livability (#248 in NC) — a middle-class / working-renter tenant base. Strengths: cost of living A+, housing A-; Watch: employment D+, crime F, amenities F.
- Haywood County Schools (suburban): math 55% / reading 53% proficiency, ranked #50 of 178 in NC (top 28%) — acceptable for families but not a draw, mixed tenant base, ~2y average lease.
- Zoned schools: Hazelwood Elementary (math 57% / reading 49%, grade C, #344 of 1,410 statewide, top 25%, 492 students, 99% FRL); Tuscola High (math 57% / reading 60%, grade C, #235 of 535 statewide, top 45%, 917 students, 49% FRL) — zoned schools average 74% FRL vs 49% district-wide (26 pts higher); higher-poverty schools than district average — tighter screening recommended.
- Watch-outs: flood insurance adds $66/mo.
- Market conditions: 291 active listings in the ZIP; 537 units permitted in Haywood County in 2024 (150 in 5+ unit buildings).
- Climate carrying-cost: severe flood risk — expect insurance premiums to compound above CPI over the hold.
- Cap rate 6.3% vs local median 2.1% in Waynesville — top-decile yield for the area; either an underpriced asset or a hidden risk that comps aren't pricing in. Stress-test before assuming the spread holds.
- This rent runs 40% of the median local income ($59k/yr) — at the standard rent-burdened threshold; future hikes will face affordability resistance.
Questions for listing agent
- What do current leases actually rent for vs. the listed asking? Can we see a recent rent roll and the last 12 months of T-12 income?
- Built in 1978 — when were the roof, HVAC, electrical panel, plumbing, and water heater last replaced?
- What's the actual annual flood-insurance premium (NFIP or private), and is the property in a SFHA with mandatory coverage?
- Is there a deadline driving the sale (1031 exchange, divorce, estate, relocation)? That informs how much negotiation room exists.
- Schools are D-rated, which usually means shorter tenancies and higher turnover. Who's the typical renter profile here, and what's been the actual vacancy rate?
- Crime grade is F in this area — have there been break-ins, vandalism, or insurance claims at this property in the last 3 years? What carrier currently insures it and at what premium?
- The area grade is low — what's the realistic commute time and amenity access for the typical tenant pool here? Any planned neighborhood developments (good or bad) we should know about?
- What's the average days-on-market for RENTAL listings here right now (not sales)? A rising rental-DOM trend means longer vacancies and softer asking-rent achievability than the comps imply.
CashFlowRE · CFR-2BF5J5F6656XBA
· Data 2 days ago
cashflowre.app · 2026-05-29