 Multi-family
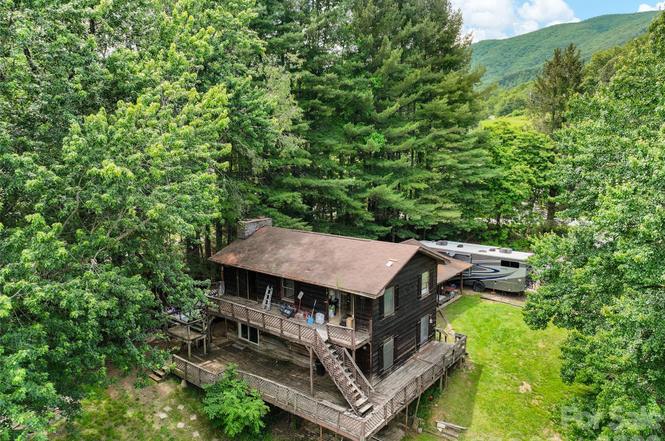
277 Orion Davis Rd · Waynesville, NC
Flood risk 10/10 · Severe
- FEMA flood zone
- X (unshaded)
- Chance of flooding over 30 yrs
- 0.99%
- Est. flood insurance / yr
- $507 – $1,088
Fire risk 4/10 · Minor
- Est. fire insurance / yr
- $906 – $1,684
Heat risk 3/10 · Minor
- Hot days now (above 91°F)
- 9 days/yr
- Hot days in 30 yrs
- 27 days/yr
Wind risk 2/10 · Minimal
- Chance of severe wind over 30 yrs
- —
Air-quality risk 3/10 · Minor
- Unhealthy air days now
- 3 days/yr
- Unhealthy air days in 30 yrs
- 3 days/yr
Risk factors via First Street. Map © Google.
Why this score? — see what drove the D grade
The composite is a weighted blend of 9 inputs, each scored 0–100. Each bar is that input's sub-score; the figure is the points it added to the 100-point composite (weight × sub-score).
- Cash flow +13.4/30.0
- ARV discount +7.5/15.0
- Schools +4.5/10.0
- DSCR +4.0/10.0
- Livability +3.4/5.0
- 1% rule +2.9/10.0
- Rent growth +2.5/5.0
- Condition / age +2.5/5.0
- Appreciation +0.0/10.0
$249,900
🖨 Deal sheet 📄 Offer letter ✓ Due diligence
Multi-family units
County records classify this as Multi-Family (5+ Unit). Listing-text estimate: 1 unit. estimate disagrees with records
5+ unit building — per-unit beds/baths from public records are typically unavailable; the breakdown below (if shown) is an estimate from the listing text.
Listing remarks
This versatile 3,800+ square foot single-family home has been converted into six rental units, offering an excellent opportunity for investors or owner-occupants seeking steady income in a convenient location. The property features five 1-bedroom units and one spacious 2-bedroom unit, providing flexible living options. Three units are located on the main level, two on the upper level, and one in the basement, allowing for easy access and management. Situated on a beautiful, level 1.36-acre lot with a small creek running through the property, the home offers plenty of outdoor space and privacy. The large parking area easily accommodates multiple vehicles and includes a 50-amp hookup for camp
Key facts
- Wood siding
- Six rental units
- Level 1.36 acre lot
Tags
Property features AI
Finance
- Other: Property zoned none (no zoning specification provided)
- HOA & community: No HOA; No community features listed
Exterior
- Parking: Driveway (no main-level garage)
- Utilities: Well water; Septic system installed; Roads are gravel and paved and publicly maintained
- Home design: Single family residence; Site built construction; One and one-half levels; Has additional parcels
- Construction: Wood construction
- Exterior features: Corner lot; Level lot; Creek/stream on property; External features noted as 'Other - See Remarks'
Interior
- Kitchen: No appliances listed
- Bedrooms: 7 bedrooms total — 3 on main level, 2 on upper level, 2 in basement
- Bathrooms: 5 full bathrooms total — 2 on main level, 2 on upper level, 1 in basement
- Heating & cooling: No heating listed; No cooling listed
- Interior features: 18 total rooms; Basement present (other features)
- Laundry & utility: No laundry features listed
Neighborhood map
What this means for you Summary
Snapshot
- This is a 7-bed/5.0-bath multifamily listed at $250k.
Deal economics
- At list price, monthly cash flow is $-64 ($-762/yr) — negative.
- To cash-flow at today's rent, offer at most $239k (4.5% below list).
- To meet the 1% rule (rent ≥ 1% of price), the offer needs to be $196k (21.5% below list).
- Recommended offer: $196k (21.5% below list) — sets the bar for 1% rule.
- Cap rate 6.3% vs local median 2.1% in Waynesville — top-decile yield for the area; either an underpriced asset or a hidden risk that comps aren't pricing in. Stress-test before assuming the spread holds.
Location & tenants
- Location reads 67/100 on livability (#248 in NC) — a middle-class / working-renter tenant base. Strengths: cost of living A+, housing A-; Watch: employment D+, crime F, amenities F.
- Haywood County Schools (suburban): math 55% / reading 53% proficiency, ranked #50 of 178 in NC (top 28%) — acceptable for families but not a draw, mixed tenant base, ~2y average lease.
- Zoned schools: Hazelwood Elementary (math 57% / reading 49%, grade C, #344 of 1,410 statewide, top 25%, 492 students, 99% FRL); Tuscola High (math 57% / reading 60%, grade C, #235 of 535 statewide, top 45%, 917 students, 49% FRL) — zoned schools average 74% FRL vs 49% district-wide (26 pts higher); higher-poverty schools than district average — tighter screening recommended.
- Market conditions: 291 active listings in the ZIP; 537 units permitted in Haywood County in 2024 (150 in 5+ unit buildings).
- This rent runs 40% of the median local income ($59k/yr) — at the standard rent-burdened threshold; future hikes will face affordability resistance.
Forward outlook
- Local home prices are declining (-3.0%/yr); year-one equity from $2k of loan paydown is wiped out by about $7k of value loss. Plan a longer hold.
Negotiation context
- Only 8 days on market — expect competitive offers; lowballing is unlikely to land.
Risks & watch-outs
- Watch-outs: flood insurance adds $66/mo.
- Climate carrying-cost: severe flood risk — expect insurance premiums to compound above CPI over the hold.
Questions for the listing agent
- What do current leases actually rent for vs. the listed asking? Can we see a recent rent roll and the last 12 months of T-12 income?
- Built in 1978 — when were the roof, HVAC, electrical panel, plumbing, and water heater last replaced?
- What's the actual annual flood-insurance premium (NFIP or private), and is the property in a SFHA with mandatory coverage?
- Is there a deadline driving the sale (1031 exchange, divorce, estate, relocation)? That informs how much negotiation room exists.
- Schools are D-rated, which usually means shorter tenancies and higher turnover. Who's the typical renter profile here, and what's been the actual vacancy rate?
- Crime grade is F in this area — have there been break-ins, vandalism, or insurance claims at this property in the last 3 years? What carrier currently insures it and at what premium?
- The area grade is low — what's the realistic commute time and amenity access for the typical tenant pool here? Any planned neighborhood developments (good or bad) we should know about?
- What's the average days-on-market for RENTAL listings here right now (not sales)? A rising rental-DOM trend means longer vacancies and softer asking-rent achievability than the comps imply.
- What's the recent tenant-quality profile in this submarket — average credit score on applications, eviction rate, late-payment / NSF rate, and stable-employment percentage? A property-management company in the area should have these aggregated.
- How much new apartment / multifamily construction is in the pipeline within 1–3 miles? Heavy new supply (>2% of stock underway) typically softens rents 12–24 months out; light construction supports rent growth.
Investment metrics
- 1% rule
- 0.79% ✗
- Cap rate
- 6.31%
- Cash-on-cash
- 0.05%
- DSCR
- 1.00
- GRM
- 10.6
CMA / ARV
No comps found within radius.
Projected returns pro-forma
-3.0% appreciation · 3.0% rent growth · sell at horizon
- IRR
- -18.1%
- Equity multiple
- 0.36×
- Total profit
- $-44,581
- Equity at exit
- $37,261
- IRR
- -10.4%
- Equity multiple
- 0.37×
- Total profit
- $-44,193
- Equity at exit
- $21,607
Cash invested: $69,972 (down + closing). Projections, not guarantees.
Landlord ↔ Tenant lean methodology
- Overall (STATE)
- 85 Strongly Landlord-Friendly
- State North Carolina
- 85 Strongly Landlord-Friendly · R+3
- County
- — inherits STATE
- City
- — inherits STATE
ZIP-level market 28786
- Active inventory
- 291
- Price-to-rent
- 10.6×
Monthly cashflow live
- Estimated rent
- $1,962 medium interval (Pro) →
- Mortgage (P&I)
- −$1,311
- Tax from tax record
- −$133 /mo · $1,593/yr
- Insurance
- −$104
- Flood insurance flood zone
- −$66 /mo · $798/yr
- HOA
- −$0
- Vacancy / Maint / Mgmt
- −$412
- Net cashflow
- $-64
Break-even live
UW: 25.0% down · 7.5% · 30yr · 1.5% tax · 5.0% vac · 8.0% maint · 8.0% mgmt
Financing live
Cash to close
- Down payment
- $62,475
- Closing costs
- $7,497
- Reserves months
- —
- Total cash needed
- —
Loan-product check · same deal, 3 products live
Conventional
25% down · 7.5% · 30yr
- Down + closing
- —
- Monthly P&I
- —
- Monthly cashflow
- —
- DSCR
- —
- Eligible?
- —
Personal DTI + credit; lowest rate.
DSCR
20% down · 8.5% · 30yr
- Down + closing
- —
- Monthly P&I
- —
- Monthly cashflow
- —
- DSCR
- —
- Eligible?
- —
No personal income docs; deal must DSCR.
Hard money
10% down · 12.0% · 12mo
- Down + closing
- —
- Monthly P&I
- —
- Monthly cashflow
- —
- DSCR
- —
- Eligible?
- —
Short-term bridge; refi at stabilization.
Listing history 7 events
-
2026-06-18days on market $249,900 Active 8 DOM
-
2026-06-17days on market $249,900 Active 7 DOM
-
2026-06-16days on market $249,900 Active 6 DOM
-
2026-06-15days on market $249,900 Active 5 DOM
-
2026-06-14days on market $249,900 Active 3 DOM
-
2026-06-13remarks 699-char remark
-
2026-06-13$249,900 Active 2 DOM
ⓘ Source: listings_history table (triggers on properties + properties_extension) + one-shot
backfill from property_details.listing_events for pre-trigger history.
Tax reassessment forecast NC · Resets to sale price
- Current annual tax
- $1,593 · $133/mo
- Projected year-2 tax
- $2,049 · $171/mo
- Expected delta
- +$456/yr (+$38/mo · 28.6%)
ⓘ Screening estimate from a state-policy table — verify with the county assessor before closing.
Climate risk First Street
- Flood 10/10 Extreme FEMA zone X (unshaded) · 99% chance over 30 yrs
- Wildfire 4/10 Moderate
- Heat 3/10 Moderate 9 d/yr ≥91°F today · 27 d/yr by 30 yrs out
- Wind 2/10 Low
- Air quality 3/10 Moderate 3 unhealthy d/yr today · 3 by 30 yrs out
Nearby sold comps map
Loading sold comps map…
Walkable amenities ~0.75 mi
Loading nearby amenities…
Taxation est. · year 1
- Rental income
- $23,549
- − Mortgage interest
- −$13,998
- − Property taxes
- −$1,593
- − Insurance
- −$2,047
- − Repairs & maintenance
- −$1,884
- − Management
- −$1,884
- − Depreciation
- −$7,270
- Taxable loss
- −$5,127
- Est. tax savings @ 24.0%
- +$1,230
- After-tax cash flow
- $468/yr
For passive investors: Depreciation is non-cash, so a rental often shows a tax loss while cash-flowing — sheltering income. Rental losses are passive: they offset passive income freely, and up to $25,000/yr can offset ordinary (W-2) income if you actively participate and your MAGI is under $100k (phasing out to $0 by $150k); unused losses carry forward. On sale, claimed depreciation is recaptured at up to 25%, and gains may owe capital-gains tax (a 1031 exchange can defer both). Figures are a year-1 estimate at your 24.0% rate — not tax advice; consult a CPA.
Schools (NCES district)
- District
- Haywood County Schools
- NCES district ID
- 3702040
- Math proficiency
- 55% ▲ 7.00%
- Reading proficiency
- 53% ▲ 2.00%
- Median HH income
- $42,715
- Composite
- 45.42/100
- National rank
- #2623
- State rank
- #50 of 178 in NC
Livability — Waynesville
- Score
- 67/100
- State rank
- #248
- US rank
- #11055
Category grades
Schools grade is shown separately in the Schools card above.
Census & demographics
- County
- Haywood County · 22,056 people
- City population
- 22,056
- Metro
- Asheville, NC
- Population (ZIP)
- 22,056
- Household income
- $59,371
- Rent vs Own
- Severe rent burden
- 611.0
Population outlook (Haywood County) Hauer SSP2
- Today (2025)
- 61,607 people
- By 2030
- 62,137 · +0.9%
- By 2040
- 62,418 · +1.3%
- By 2050
- 61,578 · +-0.0%
- By 2075
- 59,137 · -4.0%
- By 2100
- 53,470 · -13.2%
Race, ethnicity, and origin ACS 2023
- Neighborhood character
- Predominantly White (89%)
- Race & ethnicity
- White 89% Two or more races 6% Hispanic / Latino 6% Black 2%
- Hispanic origin (detail)
- Mexican 2% Puerto Rican 1%
- Common ancestry
- Slovak 5% Serbian 5% Lithuanian 3%
- Foreign-born
- 3% · Canada
- Languages at home
- 97% English-only · Spanish 2%
Political lean MEDSL · Haywood
- 2024 margin
- Strong R (+25.1) · D 36.9% · R 62.0% · Other 1.1%
- 2008→2024 swing
- -17.4pp toward R · 2008: -7.8pp · 2024: -25.1pp
- All cycles
- 2024: R+25.1 2020: R+26.5 2016: R+28.0 2012: R+13.8 2008: R+7.8
Not yet ingested
- Civics
- —
Market trends
- HPI YoY
- ▼ -132.00%
- Current HPI
- 203.0776
- Rent YoY
- —
- Metro
- Asheville, NC
- State GDP YoY
- ▲ 3.28%
- F500 in state
- 26
Industry mix (Fortune 500 HQ in NC)
| Industry | F500 HQs | Revenue |
|---|---|---|
| Financial Services | 2 | $213B |
|
||
| Retail | 2 | $95B |
|
||
| Industrial Conglomerate | 1 | $38B |
|
||
| Metals / Steel | 1 | $35B |
|
||
| Utilities | 1 | $30B |
|
||
| Industrial Machinery | 1 | $19B |
|
||
Price history
1 event — show timeline
- 2026-06-10 Listed $249,900 CANOPYMLS as Distributed by MLS Grid
Property tax history
+2.2%/yrLatest (2025): $1,593 · +0.0% YoY. Source: county tax records.
Cash-flow waterfall
monthlySold comps — $/sqft
last 12 mo · ≤1 miLoading sold comps…