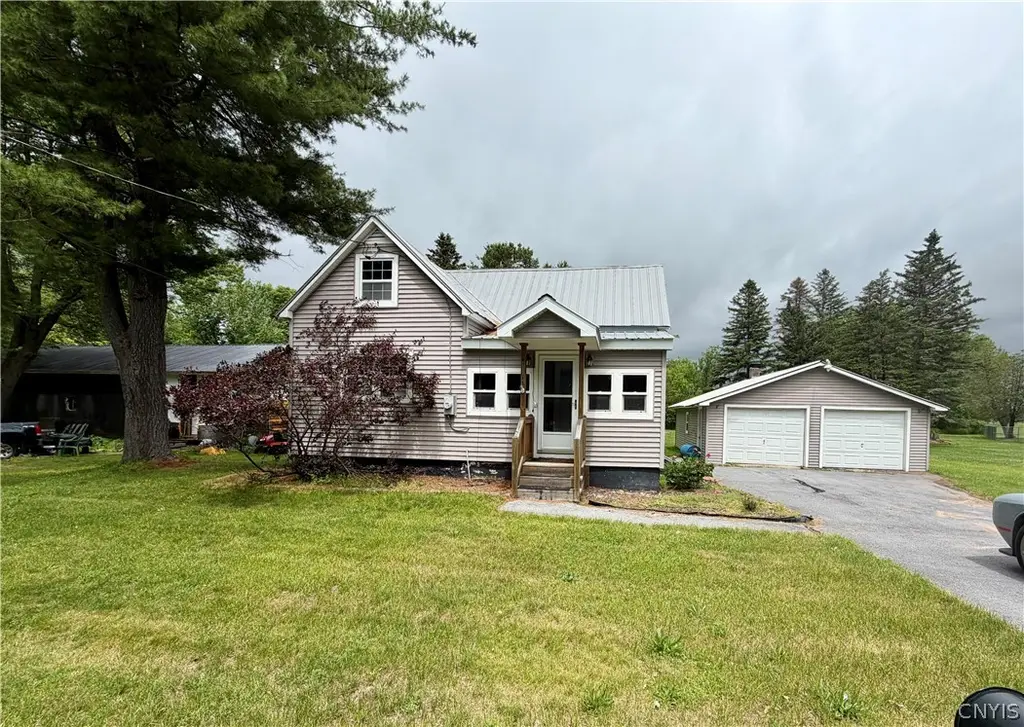
573 S Washington St
Carthage, NY 13619
$150,000C-
3 bd · 1.0 ba ·
1,214 sqft ·
Built 1920
· SingleFamily
· Active
· 5 DOM
Cashflow @ list (25.0% down · 7.5%)
Estimated rent
$1,359/mo
Mortgage (P&I)
−$787
Tax + insurance
−$334
HOA
−$0
Vac / Maint / Mgmt
−$285
Net cashflow
$-47/mo
Annual
$-567/yr
Cap rate
5.92%
Cash-on-cash
-1.35%
DSCR
0.94
1% rule
0.91%
Cash to close
$42,000
Investor read
- This is a 3-bed/1.0-bath single-family listed at $150k.
- At list price, monthly cash flow is $-47 ($-567/yr) — negative.
- To cash-flow at today's rent, offer at most $142k (5.6% below list).
- To meet the 1% rule (rent ≥ 1% of price), the offer needs to be $136k (9.4% below list).
- Only 5 days on market — expect competitive offers; lowballing is unlikely to land.
- Recommended offer: $136k (9.4% below list) — sets the bar for 1% rule.
- In year one you build about $16k of equity ($1k loan paydown + $15k appreciation (10.0% local appreciation)).
- Location reads 69/100 on livability (#506 in NY) — a middle-class / working-renter tenant base. Strengths: health & safety A+, cost of living A, crime B; Watch: employment D+, amenities F, commute F.
- Carthage Central School District (rural): math 30% / reading 46% proficiency, ranked #539 of 590 in NY (top 91%) — families likely to look elsewhere, expect single-tenant / working-renter base with shorter leases.
- Zoned schools: Carthage Elementary School (math 12% / reading 37%, grade F, #1,846 of 2,108 statewide, top 91%, 378 students, 63% FRL); Carthage Middle School (math 19% / reading 41%, grade F, #539 of 729 statewide, top 74%, 899 students, 51% FRL); Carthage Senior High School (math 92% / reading 72%, grade A, #452 of 1,100 statewide, top 44%, 815 students, 52% FRL) — zoned schools average 55% FRL vs 31% district-wide (24 pts higher); higher-poverty schools than district average — tighter screening recommended.
- Watch-outs: built in 1920 — expect roof / HVAC / electrical / plumbing capex.
- Market conditions: 78 active listings in the ZIP; 1 comparable units currently listed for rent nearby; 196 units permitted in Jefferson County in 2024 (0 in 5+ unit buildings).
- Jefferson County population projected at -12% by 2050 — secular population decline; favor cash flow + early exit over multi-decade hold.
- 5 sale attempts since 13y ago with the ask held roughly flat each time — persistent listings suggest the price (not the market) is what's stuck; bring a comps-based counter.
- Current owner paid $105k; 43% above their basis — modest negotiation headroom, anchor on the comps not their cost.
- At projected returns (10.0% appreciation + 3.0% rent growth), your $42k cash investment doubles in ~3 years — after that, you're playing with house money.
- By year 3, paydown + projected appreciation supports a ~$41k cash-out refi (75% LTV) — recoverable capital for the next deal without selling this one.
Questions for listing agent
- What do current leases actually rent for vs. the listed asking? Can we see a recent rent roll and the last 12 months of T-12 income?
- Built in 1920 — when were the roof, HVAC, electrical panel, plumbing, and water heater last replaced?
- Is there a deadline driving the sale (1031 exchange, divorce, estate, relocation)? That informs how much negotiation room exists.
- What's the average days-on-market for RENTAL listings here right now (not sales)? A rising rental-DOM trend means longer vacancies and softer asking-rent achievability than the comps imply.
- What's the recent tenant-quality profile in this submarket — average credit score on applications, eviction rate, late-payment / NSF rate, and stable-employment percentage? A property-management company in the area should have these aggregated.
- How much new for-sale + rental construction is in the pipeline within 1–3 miles? Heavy new supply typically softens prices + rents 12–24 months out; constrained supply supports both.
CashFlowRE · CFR-2BFT8M031P741Z
· Data 19 h ago
cashflowre.app · 2026-05-29