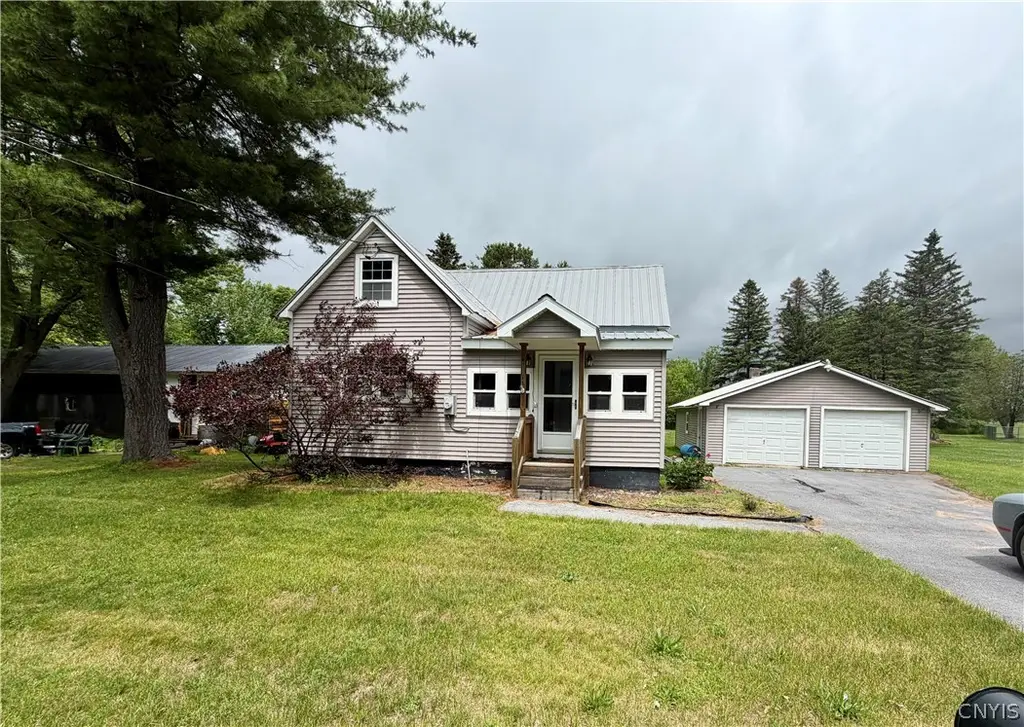
573 S Washington St · Carthage, NY
Flood risk 1/10 · Minimal
- FEMA flood zone
- —
- Chance of flooding over 30 yrs
- 0.0%
- Est. flood insurance / yr
- —
Fire risk 2/10 · Minimal
- Est. fire insurance / yr
- $691 – $1,283
Heat risk 1/10 · Minimal
- Hot days now (above 91°F)
- 7 days/yr
- Hot days in 30 yrs
- 16 days/yr
Wind risk 1/10 · Minimal
- Chance of severe wind over 30 yrs
- —
Air-quality risk 2/10 · Minimal
- Unhealthy air days now
- 0 days/yr
- Unhealthy air days in 30 yrs
- 1 days/yr
Risk factors via First Street. Map © Google.
Why this score? — see what drove the C- grade
The composite is a weighted blend of 9 inputs, each scored 0–100. Each bar is that input's sub-score; the figure is the points it added to the 100-point composite (weight × sub-score).
- ARV discount +14.2/15.0
- Cash flow +11.6/30.0
- Appreciation +10.0/10.0
- 1% rule +4.1/10.0
- Livability +3.5/5.0
- DSCR +3.4/10.0
- Schools +3.3/10.0
- Rent growth +2.5/5.0
- Condition / age +2.5/5.0
$150,000
🖨 Deal sheet (PDF) 📄 Offer letter ✓ Due diligence
Listing remarks MLS
This extremely nice, 2 bedroom home has been remodeled from top to bottom to a high level. Beautiful kitchen w/ a generous amount of cabinetry, island, SS appliances & pantry. Good-size living room. Nice bathroom w/ tiled floors, dbl vanity & front-load laundry. Upstairs are the large master bedroom w/ dbl closets & another bedroom. Great woodwork throughout. Heated front porch. Incredibly efficient, w/ heat & electricity averaging well below $100/month. Nice, private yard for your outdoor enjoyment. Oversized, 2-car garage. An excellent home that is easy on the budget. Call today!
Key facts
- Covered porch
- Flat lot
- Paved driveway
Tags
Property features AI
Exterior
- Parking: Detached garage; 2-car garage
- Utilities: Electricity connected; Public water connected; Sewer connected
- Home design: Two-story home; Existing/resale property
- Construction: Vinyl siding; Stone foundation
- Exterior features: Blacktop driveway; Irregular residential lot; Road frontage on a city street; Lot dimensions approximately 132 x 190
Interior
- Kitchen: Dishwasher; Gas oven; Gas range; Refrigerator
- Bedrooms: Total of 5 rooms including living spaces and a loft
- Flooring: Carpet; Laminate; Varies
- Bathrooms: 1 full bathroom (main level)
- Heating & cooling: Gas forced-air heating
- Interior features: Eat-in kitchen; Kitchen island; Separate/formal living room; Loft; Partial basement
- Laundry & utility: Main-level laundry; Gas water heater
Neighborhood map
What this means for you Summary
Snapshot
- This is a 3-bed/1.0-bath single-family listed at $150k.
Deal economics
- At list price, monthly cash flow is $-47 ($-567/yr) — negative.
- To cash-flow at today's rent, offer at most $142k (5.6% below list).
- To meet the 1% rule (rent ≥ 1% of price), the offer needs to be $136k (9.4% below list).
- Recommended offer: $136k (9.4% below list) — sets the bar for 1% rule.
Location & tenants
- Location reads 69/100 on livability (#506 in NY) — a middle-class / working-renter tenant base. Strengths: health & safety A+, cost of living A, crime B; Watch: employment D+, amenities F, commute F.
- Carthage Central School District (rural): math 30% / reading 46% proficiency, ranked #539 of 590 in NY (top 91%) — families likely to look elsewhere, expect single-tenant / working-renter base with shorter leases.
- Zoned schools: Carthage Elementary School (math 12% / reading 37%, grade F, #1,846 of 2,108 statewide, top 91%, 378 students, 63% FRL); Carthage Middle School (math 19% / reading 41%, grade F, #539 of 729 statewide, top 74%, 899 students, 51% FRL); Carthage Senior High School (math 92% / reading 72%, grade A, #452 of 1,100 statewide, top 44%, 815 students, 52% FRL) — zoned schools average 55% FRL vs 31% district-wide (24 pts higher); higher-poverty schools than district average — tighter screening recommended.
- Market conditions: 78 active listings in the ZIP; 1 comparable units currently listed for rent nearby; 196 units permitted in Jefferson County in 2024 (0 in 5+ unit buildings).
Forward outlook
- In year one you build about $16k of equity ($1k loan paydown + $15k appreciation (10.0% local appreciation)).
- Jefferson County population projected at -12% by 2050 — secular population decline; favor cash flow + early exit over multi-decade hold.
- At projected returns (10.0% appreciation + 3.0% rent growth), your $42k cash investment doubles in ~3 years — after that, you're playing with house money.
- By year 3, paydown + projected appreciation supports a ~$41k cash-out refi (75% LTV) — recoverable capital for the next deal without selling this one.
Negotiation context
- Only 5 days on market — expect competitive offers; lowballing is unlikely to land.
- 5 sale attempts since 13y ago with the ask held roughly flat each time — persistent listings suggest the price (not the market) is what's stuck; bring a comps-based counter.
- Current owner paid $105k; 43% above their basis — modest negotiation headroom, anchor on the comps not their cost.
Risks & watch-outs
- Watch-outs: built in 1920 — expect roof / HVAC / electrical / plumbing capex.
Questions for the listing agent
- What do current leases actually rent for vs. the listed asking? Can we see a recent rent roll and the last 12 months of T-12 income?
- Built in 1920 — when were the roof, HVAC, electrical panel, plumbing, and water heater last replaced?
- Is there a deadline driving the sale (1031 exchange, divorce, estate, relocation)? That informs how much negotiation room exists.
- What's the average days-on-market for RENTAL listings here right now (not sales)? A rising rental-DOM trend means longer vacancies and softer asking-rent achievability than the comps imply.
- What's the recent tenant-quality profile in this submarket — average credit score on applications, eviction rate, late-payment / NSF rate, and stable-employment percentage? A property-management company in the area should have these aggregated.
- How much new for-sale + rental construction is in the pipeline within 1–3 miles? Heavy new supply typically softens prices + rents 12–24 months out; constrained supply supports both.
Investment metrics
- 1% rule
- 0.91% ✗
- Cap rate
- 5.92%
- Cash-on-cash
- -1.35%
- DSCR
- 0.94
- GRM
- 9.2
CMA / ARV
- ARV (on-the-fly)
- $176,030
- Comps found
- 4
Show comp detail 4 sales within ~0.75 mi
| Address | Dist | Beds/Ba | Sqft | Sold | Price | $/sf | Match |
|---|---|---|---|---|---|---|---|
| 313 S Washington St | 0.53mi | 3/1.0 | 1,188 (-2%) | 10mo | $175,000 | $147 | 63 |
| 427 S James St | 0.37mi | 3/1.0 | 1,325 (+9%) | 11mo | $141,300 | $107 | 58 |
| 528 S Mechanic St | 0.27mi | 2/1.0 (-1) | 1,105 (-9%) | 20mo | $159,900 | $145 | 51 |
| 620 West St | 0.64mi | 3/1.0 | 1,344 (+11%) | 11mo | $187,500 | $140 | 43 |
Match score weights: distance 35% · size 25% · config 20% · recency 20%. Top-matched comps best support the ARV.
Projected returns pro-forma
10.0% appreciation · 3.0% rent growth · sell at horizon
- IRR
- 23.3%
- Equity multiple
- 2.88×
- Total profit
- $78,759
- Equity at exit
- $135,132
- IRR
- 20.8%
- Equity multiple
- 6.58×
- Total profit
- $234,440
- Equity at exit
- $291,417
Cash invested: $42,000 (down + closing). Projections, not guarantees.
Landlord ↔ Tenant lean methodology
- Overall (STATE)
- 15 Strongly Tenant-Friendly
- State New York
- 15 Strongly Tenant-Friendly · D+10
- County
- — inherits STATE
- City
- — inherits STATE
ZIP-level market 13619
- Home prices YoY
- 26.0%
- Active inventory
- 78
- Price-to-rent
- 9.2×
Monthly cashflow live
- Estimated rent
- $1,359 medium interval (Pro) →
- Mortgage (P&I)
- −$787
- Tax from tax record
- −$271 /mo · $3,258/yr
- Insurance
- −$62
- HOA
- −$0
- Vacancy / Maint / Mgmt
- −$285
- Net cashflow
- $-47
Break-even live
Sensitivity live
| Price | -10% $38 | -5% $-5 | +0% $-47 | +5% $-90 | +10% $-132 |
|---|---|---|---|---|---|
| Rent | -10% $-155 | -5% $-101 | +0% $-47 | +5% $6 | +10% $60 |
| Rate | -1.0pp $28 | -0.5pp $-9 | base $-47 | +0.5pp $-86 | +1.0pp $-126 |
UW: 25.0% down · 7.5% · 30yr · 1.5% tax · 5.0% vac · 8.0% maint · 8.0% mgmt
Financing live
Cash to close
- Down payment
- $37,500
- Closing costs
- $4,500
- Reserves months
- —
- Total cash needed
- —
Loan-product check · same deal, 3 products live
Conventional
25% down · 7.5% · 30yr
- Down + closing
- —
- Monthly P&I
- —
- Monthly cashflow
- —
- DSCR
- —
- Eligible?
- —
Personal DTI + credit; lowest rate.
DSCR
20% down · 8.5% · 30yr
- Down + closing
- —
- Monthly P&I
- —
- Monthly cashflow
- —
- DSCR
- —
- Eligible?
- —
No personal income docs; deal must DSCR.
Hard money
10% down · 12.0% · 12mo
- Down + closing
- —
- Monthly P&I
- —
- Monthly cashflow
- —
- DSCR
- —
- Eligible?
- —
Short-term bridge; refi at stabilization.
Rent comps 1 comps
| Address | Beds | Baths | Sqft | Rent | $/sqft | DOM | Units | Dist |
|---|---|---|---|---|---|---|---|---|
| 719 Alexandria St Unit 719 Carthage, NY | 3.0 | 1.0 | 1100 | $995 | $0.90 | 45d | 1 | 1.09mi |
Listing history 5 events
-
2026-06-21days on market $150,000 Active 5 DOM
-
2026-06-19days on market $150,000 Active 3 DOM
-
2026-06-18days on market $150,000 Active 2 DOM
-
2026-06-17remarks 699-char remark
-
2026-06-17$150,000 Active 1 DOM
ⓘ Source: listings_history table (triggers on properties + properties_extension) + one-shot
backfill from property_details.listing_events for pre-trigger history.
Tax reassessment forecast NY · Partial reset (capped growth)
- Current annual tax
- $3,258 · $271/mo
- Projected year-2 tax
- $3,258 · $271/mo
- Expected delta
- $0/yr ($0/mo · 0.0%)
ⓘ Screening estimate from a state-policy table — verify with the county assessor before closing.
Climate risk First Street
- Flood 1/10 Low 0% chance over 30 yrs
- Wildfire 2/10 Low
- Heat 1/10 Low 7 d/yr ≥91°F today · 16 d/yr by 30 yrs out
- Wind 1/10 Low
- Air quality 2/10 Low 0 unhealthy d/yr today · 1 by 30 yrs out
Nearby sold comps map
Loading sold comps map…
Walkable amenities ~0.75 mi
Loading nearby amenities…
Taxation est. · year 1
- Rental income
- $16,305
- − Mortgage interest
- −$8,402
- − Property taxes
- −$3,258
- − Insurance
- −$750
- − Repairs & maintenance
- −$1,304
- − Management
- −$1,304
- − Depreciation
- −$4,364
- Taxable loss
- −$3,078
- Est. tax savings @ 24.0%
- +$739
- After-tax cash flow
- $172/yr
For passive investors: Depreciation is non-cash, so a rental often shows a tax loss while cash-flowing — sheltering income. Rental losses are passive: they offset passive income freely, and up to $25,000/yr can offset ordinary (W-2) income if you actively participate and your MAGI is under $100k (phasing out to $0 by $150k); unused losses carry forward. On sale, claimed depreciation is recaptured at up to 25%, and gains may owe capital-gains tax (a 1031 exchange can defer both). Figures are a year-1 estimate at your 24.0% rate — not tax advice; consult a CPA.
Schools (NCES district)
- District
- Carthage Central School District
- NCES district ID
- 3606630
- Math proficiency
- 30% ▼ -18.00%
- Reading proficiency
- 46% ▲ 2.00%
- Median HH income
- $48,450
- Composite
- 32.63/100
- National rank
- #5668
- State rank
- #539 of 590 in NY
Livability — Carthage
- Score
- 69/100
- State rank
- #506
- US rank
- #8895
Category grades
Schools grade is shown separately in the Schools card above.
Census & demographics
- Census place
- Carthage, NY
- County
- Jefferson County · 47,417 people
- City population
- 10,578
- Metro
- Watertown-Fort Drum, NY
- Population (ZIP)
- 10,578
- Household income
- $63,120
- Rent vs Own
- Severe rent burden
- 379.0
Population outlook (Jefferson County) Hauer SSP2
- Today (2025)
- 111,748 people
- By 2030
- 109,370 · -2.1%
- By 2040
- 103,828 · -7.1%
- By 2050
- 98,523 · -11.8%
- By 2075
- 91,422 · -18.2%
- By 2100
- 78,214 · -30.0%
Race, ethnicity, and origin ACS 2023
- Neighborhood character
- Predominantly White (83%)
- Race & ethnicity
- White 83% Two or more races 8% Hispanic / Latino 6% Black 2%
- Hispanic origin (detail)
- Mexican 1% Puerto Rican 2%
- Common ancestry
- Lithuanian 9% Romanian 3% Iranian 1%
- Foreign-born
- 4% · Canada
- Languages at home
- 95% English-only · Spanish 3% Tagalog/Filipino 1%
Political lean MEDSL · Jefferson
- 2024 margin
- Strong R (+23.6) · D 38.2% · R 61.8%
- 2008→2024 swing
- -18.3pp toward R · 2008: -5.3pp · 2024: -23.6pp
- All cycles
- 2024: R+23.6 2020: R+19.0 2016: R+22.4 2012: R+2.9 2008: R+5.3
Not yet ingested
- Civics
- —
Market trends
- HPI YoY
- ▲ 84.02%
- Current HPI
- 406.9439
- Rent YoY
- —
- Metro
- Watertown-Fort Drum, NY
- State GDP YoY
- ▲ 2.60%
- F500 in state
- 92
Industry mix (Fortune 500 HQ in NY)
| Industry | F500 HQs | Revenue |
|---|---|---|
| Financial Services | 10 | $950B |
|
||
| Consumer Goods | 9 | $162B |
|
||
| Insurance | 4 | $225B |
|
||
| Telecommunications | 2 | $144B |
|
||
| Pharmaceuticals | 2 | $112B |
|
||
| Media / Entertainment | 2 | $69B |
|
||
Price history
+275.0% since first listed13 events — show timeline
- 2026-06-16 Listed $150,000 CNYIS
- 2018-11-19 Sold (Public Records) $105,000 Public Records
- 2018-11-16 Sold (MLS) $105,000 CNYIS
- 2018-09-14 Listed $114,900 CNYIS
- 2016-10-13 Listing Removed — CNYIS
- 2016-06-08 Listed $122,500 CNYIS
- 2014-11-12 Sold (Public Records) $117,000 Public Records
- 2014-11-10 Sold (MLS) $117,000 CNYIS
- 2013-10-22 Listed $122,900 CNYIS
- 2013-10-20 Listing Removed — CNYIS
- 2013-08-23 Sold (Public Records) $42,000 Public Records
- 2013-04-03 Listed $134,900 CNYIS
- 2011-10-18 Sold (Public Records) $40,000 Public Records
Property tax history
+0.2%/yrLatest (2025): $3,258 · +7.6% YoY. Source: county tax records.
Cash-flow waterfall
monthlySold comps — $/sqft
last 12 mo · ≤1 miLoading sold comps…