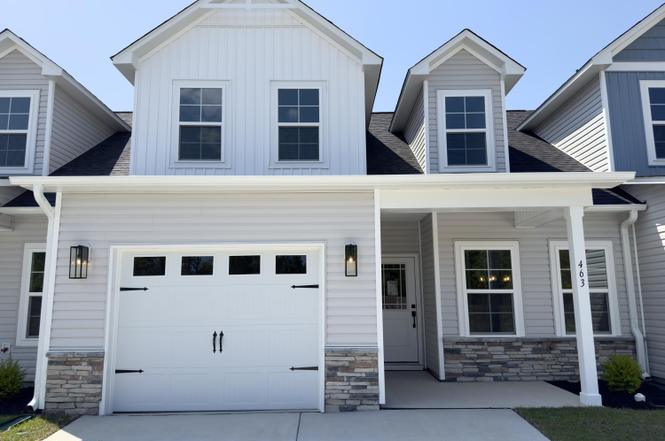
463 Timbercrest Cir SE
Varnamtown, NC 28422
$260,850D+
4 bd · 2.5 ba ·
3,614 sqft ·
Built 2025
· Townhouse
· Active
· 156 DOM
Cashflow @ list (25.0% down · 7.5%)
Estimated rent
$2,693/mo
Mortgage (P&I)
−$1,368
Tax + insurance
−$435
HOA
−$80
Vac / Maint / Mgmt
−$566
Net cashflow
$245/mo
Annual
$2,937/yr
Cap rate
7.42%
Cash-on-cash
4.02%
DSCR
1.18
1% rule
1.03%
Cash to close
$73,038
Investor read
- This is a 4-bed/2.5-bath townhouse listed at $261k.
- At list price, monthly cash flow is $245 ($3k/yr) — positive.
- The deal already cash-flows at list — no discount required.
- Meets the 1% rule at list price ($3k rent vs $261k).
- It's been on market 156 days — a 12% lower offer ($230k) is reasonable based on typical stale-listing flexibility.
- Recommended offer: $230k (12.0% below list) — sets the bar for market timing.
- Local home prices are declining (-3.0%/yr); year-one equity from $2k of loan paydown is wiped out by about $8k of value loss. Plan a longer hold.
- Location reads 60/100 on livability (#521 in NC) — a middle-class / working-renter tenant base. Strengths: cost of living A+, housing A, employment B; Watch: crime D, health & safety D, amenities F.
- Brunswick County Schools (rural): math 45% / reading 47% proficiency, ranked #82 of 178 in NC (top 46%) — families likely to look elsewhere, expect single-tenant / working-renter base with shorter leases.
- Zoned schools: Virginia Williamson Elem (math 50% / reading 49%, grade D, #417 of 1,410 statewide, top 32%, 502 students, 99% FRL); Cedar Grove Middle (math 30% / reading 36%, grade F, #305 of 475 statewide, top 65%, 434 students, 99% FRL); South Brunswick High (math 62% / reading 57%, grade C+, #216 of 535 statewide, top 43%, 1,172 students, 100% FRL) — zoned schools average 99% FRL vs 53% district-wide (46 pts higher); higher-poverty schools than district average — tighter screening recommended.
- Market conditions: 569 active listings in the ZIP; 6,112 units permitted in Brunswick County in 2024 (990 in 5+ unit buildings).
- Brunswick County population projected at +36% by 2050 — long-run rental-demand tailwind backs the buy-and-hold thesis.
- Cap rate 7.4% vs local median 3.8% in Varnamtown — top-decile yield for the area; either an underpriced asset or a hidden risk that comps aren't pricing in. Stress-test before assuming the spread holds.
- At $2,693/mo this rent would consume 47% of the median local household income ($69k/yr) (locally 243% of renters already pay >50% of income on rent) — very limited rent-growth headroom before tenants either downsize or default.
Questions for listing agent
- It's been on market 156 days. Have you received any prior offers? Is the seller open to a 12% concession, seller financing, or rate buy-down credit?
- What does the HOA fee cover, when was the last increase, and are there any pending special assessments or reserve-fund shortfalls?
- Why hasn't it sold? Are there any deal-killer items the seller is aware of (foundation, flood, title, zoning, code violations)?
- Is there a deadline driving the sale (1031 exchange, divorce, estate, relocation)? That informs how much negotiation room exists.
- Schools are F-rated, which usually means shorter tenancies and higher turnover. Who's the typical renter profile here, and what's been the actual vacancy rate?
- Crime grade is D in this area — have there been break-ins, vandalism, or insurance claims at this property in the last 3 years? What carrier currently insures it and at what premium?
- The area grade is low — what's the realistic commute time and amenity access for the typical tenant pool here? Any planned neighborhood developments (good or bad) we should know about?
- What's the average days-on-market for RENTAL listings here right now (not sales)? A rising rental-DOM trend means longer vacancies and softer asking-rent achievability than the comps imply.
CashFlowRE · CFR-2BHENKBA858485
· Data 2 days ago
cashflowre.app · 2026-05-29