2728 S 83rd Pl #2730
West Allis, WI 53219
$190,900B
3 bd · 2.0 ba ·
1,200 sqft ·
Built 1953
· MultiFamily
· Pending
· 49 DOM
Cashflow @ list (25.0% down · 7.5%)
Estimated rent
$2,651/mo
Mortgage (P&I)
−$1,001
Tax + insurance
−$318
HOA
−$0
Vac / Maint / Mgmt
−$557
Net cashflow
$775/mo
Annual
$9,300/yr
Cap rate
11.16%
Cash-on-cash
17.40%
DSCR
1.77
1% rule
1.39%
Cash to close
$53,452
Investor read
- This is a 3-bed/2.0-bath multifamily listed at $191k. Condition is rated poor.
- At list price, monthly cash flow is $775 ($9k/yr) — positive.
- The deal already cash-flows at list — no discount required.
- Meets the 1% rule at list price ($3k rent vs $191k).
- It's been on market 49 days — a 3% lower offer ($185k) is reasonable based on typical stale-listing flexibility.
- Recommended offer: $185k (3.0% below list) — sets the bar for market timing.
- Local home prices are declining (-3.0%/yr); year-one equity from $1k of loan paydown is wiped out by about $6k of value loss. Plan a longer hold.
- Location reads 79/100 on livability (#69 in WI, #1,958 nationally) — a middle-class / working-renter tenant base. Strengths: commute A+, cost of living A+, housing A+; Watch: amenities F.
- West Allis-West Milwaukee School District (urban): math 17% / reading 26% proficiency, ranked #328 of 342 in WI (top 96%) — low school quality limits family demand, transient renter base, plan for 1-2y turnover.
- Watch-outs: built in 1953 — expect roof / HVAC / electrical / plumbing capex.
- Market conditions: Rents rising fast (+5.1%/yr); 55 active listings in the ZIP; 21 comparable units currently listed for rent nearby; rentals leasing fast (median 12d on market — plan ~1-2 weeks tenant-placement turnaround); 1,017 units permitted in Milwaukee County in 2024 (803 in 5+ unit buildings).
- Milwaukee County population projected at +4% by 2050 — modest demand growth; plan on rents tracking national, not racing it.
- 3 sale attempts with the ask held roughly flat each time — persistent listings suggest the price (not the market) is what's stuck; bring a comps-based counter.
- At projected returns (-3.0% appreciation + 5.1% rent growth), your $53k cash investment doubles in ~7 years — after that, you're playing with house money.
- Cap rate 11.2% vs local median 4.3% in West Allis — top-decile yield for the area; either an underpriced asset or a hidden risk that comps aren't pricing in. Stress-test before assuming the spread holds.
- At $2,651/mo this rent would consume 45% of the median local household income ($70k/yr) (locally 902% of renters already pay >50% of income on rent) — very limited rent-growth headroom before tenants either downsize or default.
Questions for listing agent
- It's been on market 49 days. Have you received any prior offers? Is the seller open to a 3% concession, seller financing, or rate buy-down credit?
- Have any recent inspections been done? Can we get a copy of the seller's disclosures and any deferred-maintenance estimates?
- Built in 1953 — when were the roof, HVAC, electrical panel, plumbing, and water heater last replaced?
- Is there a deadline driving the sale (1031 exchange, divorce, estate, relocation)? That informs how much negotiation room exists.
- What's the average days-on-market for RENTAL listings here right now (not sales)? A rising rental-DOM trend means longer vacancies and softer asking-rent achievability than the comps imply.
- What's the recent tenant-quality profile in this submarket — average credit score on applications, eviction rate, late-payment / NSF rate, and stable-employment percentage? A property-management company in the area should have these aggregated.
- How much new apartment / multifamily construction is in the pipeline within 1–3 miles? Heavy new supply (>2% of stock underway) typically softens rents 12–24 months out; light construction supports rent growth.
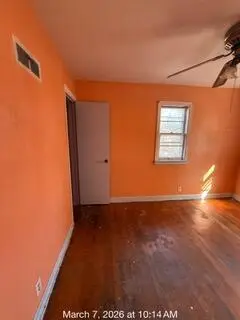
Repairs flagged (vision-AI assessment)
- Major: Paint — Peeling paint on interior walls
- Major: Flooring — Worn hardwood flooring
- Major: Windows — No windows visible, may need replacement
CashFlowRE · CFR-2BHFFKBXDHNVWV
· Data 1 week ago
cashflowre.app · 2026-05-29