 Multi-family
2728 S 83rd Pl #2730 · West Allis, WI
Flood risk 1/10 · Minimal
- FEMA flood zone
- X (unshaded)
- Chance of flooding over 30 yrs
- 0.0%
- Est. flood insurance / yr
- $473 – $860
Fire risk 1/10 · Minimal
- Est. fire insurance / yr
- $636 – $1,182
Heat risk 2/10 · Minimal
- Hot days now (above 99°F)
- 7 days/yr
- Hot days in 30 yrs
- 12 days/yr
Wind risk 2/10 · Minimal
- Chance of severe wind over 30 yrs
- —
Air-quality risk 2/10 · Minimal
- Unhealthy air days now
- 1 days/yr
- Unhealthy air days in 30 yrs
- 1 days/yr
Risk factors via First Street. Map © Google.
Why this score? — see what drove the B grade
The composite is a weighted blend of 9 inputs, each scored 0–100. Each bar is that input's sub-score; the figure is the points it added to the 100-point composite (weight × sub-score).
- Cash flow +30.0/30.0
- ARV discount +15.0/15.0
- DSCR +10.0/10.0
- 1% rule +8.9/10.0
- Livability +4.0/5.0
- Rent growth +3.8/5.0
- Schools +1.9/10.0
- Condition / age +1.0/5.0
- Appreciation +0.0/10.0
$190,900
🖨 Deal sheet 📄 Offer letter ✓ Due diligence
Multi-family units
County records classify this as Multi-Family (2-4 Unit). Listing-text estimate: 1 unit. estimate disagrees with records
Listing remarks
Cash offers. Needs work. FREEZE DAMAGE/MISSING PLUMBING. Brick/Aluminum 2 bedrooms, living room, kitchen, and bath on main level. Upper has kitchen, living room, bathroom, and one bedroom. separate utilities. Full basement. One car attached garage.
Key facts
- 6,969 sq ft lot
- Garage
- Built 1953
Property features AI
Finance
- Financial info: Multi-family property (2 units)
Exterior
- Parking: Attached 1-car garage
- Utilities: Municipal water; Municipal sewer; 2 electric meters; 2 gas meters
- Home design: 1.5-story multi-family building; Two-unit building
- Construction: Brick/stone construction; Basement: full, block (see Interior)
- Exterior features: Brick exterior; Property zoned Res RS-2; Lot is approximately 0.16 acre (less than 1/2 acre)
Interior
- Kitchen: Unit 2 kitchen located on upper level (approx. 11 x 9)
- Bedrooms: Unit 1: 2 bedrooms; Unit 2: 1 bedroom (master on upper level, approx. 8 x 8)
- Bathrooms: Unit 1: 1 full bathroom; Unit 2: 1 full bathroom
- Interior features: Full block basement
- Laundry & utility: Separate meters: 2 electric meters, 2 gas meters
Neighborhood map
What this means for you Summary
Snapshot
- This is a 3-bed/2.0-bath multifamily listed at $191k. Condition is rated poor.
Deal economics
- At list price, monthly cash flow is $775 ($9k/yr) — positive.
- The deal already cash-flows at list — no discount required.
- Meets the 1% rule at list price ($3k rent vs $191k).
- Recommended offer: $185k (3.0% below list) — sets the bar for market timing.
- Cap rate 11.2% vs local median 4.3% in West Allis — top-decile yield for the area; either an underpriced asset or a hidden risk that comps aren't pricing in. Stress-test before assuming the spread holds.
Location & tenants
- Location reads 79/100 on livability (#69 in WI, #1,958 nationally) — a middle-class / working-renter tenant base. Strengths: commute A+, cost of living A+, housing A+; Watch: amenities F.
- West Allis-West Milwaukee School District (urban): math 17% / reading 26% proficiency, ranked #328 of 342 in WI (top 96%) — low school quality limits family demand, transient renter base, plan for 1-2y turnover.
- Market conditions: Rents rising fast (+5.1%/yr); 55 active listings in the ZIP; 21 comparable units currently listed for rent nearby; rentals leasing fast (median 12d on market — plan ~1-2 weeks tenant-placement turnaround); 1,017 units permitted in Milwaukee County in 2024 (803 in 5+ unit buildings).
- At $2,651/mo this rent would consume 45% of the median local household income ($70k/yr) (locally 902% of renters already pay >50% of income on rent) — very limited rent-growth headroom before tenants either downsize or default.
Forward outlook
- Local home prices are declining (-3.0%/yr); year-one equity from $1k of loan paydown is wiped out by about $6k of value loss. Plan a longer hold.
- Milwaukee County population projected at +4% by 2050 — modest demand growth; plan on rents tracking national, not racing it.
- At projected returns (-3.0% appreciation + 5.1% rent growth), your $53k cash investment doubles in ~7 years — after that, you're playing with house money.
Negotiation context
- It's been on market 49 days — a 3% lower offer ($185k) is reasonable based on typical stale-listing flexibility.
- 3 sale attempts with the ask held roughly flat each time — persistent listings suggest the price (not the market) is what's stuck; bring a comps-based counter.
Risks & watch-outs
- Watch-outs: built in 1953 — expect roof / HVAC / electrical / plumbing capex.
Questions for the listing agent
- It's been on market 49 days. Have you received any prior offers? Is the seller open to a 3% concession, seller financing, or rate buy-down credit?
- Have any recent inspections been done? Can we get a copy of the seller's disclosures and any deferred-maintenance estimates?
- Built in 1953 — when were the roof, HVAC, electrical panel, plumbing, and water heater last replaced?
- Is there a deadline driving the sale (1031 exchange, divorce, estate, relocation)? That informs how much negotiation room exists.
- What's the average days-on-market for RENTAL listings here right now (not sales)? A rising rental-DOM trend means longer vacancies and softer asking-rent achievability than the comps imply.
- What's the recent tenant-quality profile in this submarket — average credit score on applications, eviction rate, late-payment / NSF rate, and stable-employment percentage? A property-management company in the area should have these aggregated.
- How much new apartment / multifamily construction is in the pipeline within 1–3 miles? Heavy new supply (>2% of stock underway) typically softens rents 12–24 months out; light construction supports rent growth.
Investment metrics
- 1% rule
- 1.39% ✓
- Cap rate
- 11.16%
- Cash-on-cash
- 17.40%
- DSCR
- 1.77
- GRM
- 6.0
CMA / ARV
- ARV (on-the-fly)
- $270,000
- Comps found
- 2
Show comp detail 2 sales within ~0.75 mi
| Address | Dist | Beds/Ba | Sqft | Sold | Price | $/sf | Match |
|---|---|---|---|---|---|---|---|
| 8309 W Cleveland Ave | 0.06mi | 3/2.0 | 1,335 (+11%) | 24mo | $300,000 | $225 | 59 |
| 2175 S 83rd St #2177 | 0.68mi | 4/2.0 (+1) | 1,355 (+13%) | 3mo | $305,000 | $225 | 39 |
Match score weights: distance 35% · size 25% · config 20% · recency 20%. Top-matched comps best support the ARV.
Projected returns pro-forma
-3.0% appreciation · 5.09% rent growth · sell at horizon
- IRR
- 11.1%
- Equity multiple
- 1.45×
- Total profit
- $24,158
- Equity at exit
- $28,464
- IRR
- 21.8%
- Equity multiple
- 3.04×
- Total profit
- $109,133
- Equity at exit
- $16,506
Cash invested: $53,452 (down + closing). Projections, not guarantees.
Landlord ↔ Tenant lean methodology
- Overall (STATE)
- 73 Landlord-Friendly
- State Wisconsin
- 73 Landlord-Friendly · R+2
- County
- — inherits STATE
- City
- — inherits STATE
ZIP-level market 53219
- Home prices YoY
- -29.8%
- Rents YoY
- 5.1%
- Active inventory
- 55
- Price-to-rent
- 11.1×
Monthly cashflow live
- Estimated rent
- $2,651 high interval (Pro) →
- Mortgage (P&I)
- −$1,001
- Tax est. 1.5%
- −$239 /mo · $2,864/yr
- Insurance
- −$80
- HOA
- −$0
- Vacancy / Maint / Mgmt
- −$557
- Net cashflow
- $775
Break-even live
2-unit breakdown (identical units grouped — click to expand)
| Units | Beds | Baths | Est. rent |
|---|---|---|---|
| 1× unit | 2 | 1 | $1,434 |
| 1× unit | 1 | 1 | $1,217 |
| Total (2 units) | $2,651 | ||
UW: 25.0% down · 7.5% · 30yr · 1.5% tax · 5.0% vac · 8.0% maint · 8.0% mgmt
Financing live
Cash to close
- Down payment
- $47,725
- Closing costs
- $5,727
- Reserves months
- —
- Total cash needed
- —
Loan-product check · same deal, 3 products live
Conventional
25% down · 7.5% · 30yr
- Down + closing
- —
- Monthly P&I
- —
- Monthly cashflow
- —
- DSCR
- —
- Eligible?
- —
Personal DTI + credit; lowest rate.
DSCR
20% down · 8.5% · 30yr
- Down + closing
- —
- Monthly P&I
- —
- Monthly cashflow
- —
- DSCR
- —
- Eligible?
- —
No personal income docs; deal must DSCR.
Hard money
10% down · 12.0% · 12mo
- Down + closing
- —
- Monthly P&I
- —
- Monthly cashflow
- —
- DSCR
- —
- Eligible?
- —
Short-term bridge; refi at stabilization.
Rent comps 21 comps
| Address | Beds | Baths | Sqft | Rent | $/sqft | DOM | Units | Dist |
|---|---|---|---|---|---|---|---|---|
| 7745 W Beloit Rd Milwaukee, WI | 3.0 | 1.5 | 1500 | $1,875 | $1.25 | 3d | 1 | 0.33mi |
| 2238 S 82nd St Milwaukee, WI | 2.0 | 1.0 | 1000 | $1,360 | $1.36 | 3d | 1 | 0.56mi |
| 9060 W Oklahoma Ave West Allis, WI | 2.0 | 2.0 | 850 | $1,624 | $1.91 | 23d | 3 | 0.64mi |
| 9304 W Hayes Ave Milwaukee, WI | 2.0 | 1.0 | 1000 | $1,600 | $1.60 | 23d | 1 | 0.79mi |
| 2122 S 77th St Milwaukee, WI | 4.0 | 1.5 | 1434 | $1,895 | $1.32 | 14d | 1 | 0.84mi |
| 2034 S 81st St West Allis, WI | 2.0 | 1.0 | 900 | $1,800 | $2.00 | 3d | 1 | 0.86mi |
| 8734 W Becher St Milwaukee, WI | 2.0 | 1.0 | 1500 | $2,300 | $1.53 | 12d | 1 | 0.86mi |
| 9129 W National Ave Unit 4 Milwaukee, WI | 2.0 | 1.0 | 1090 | $1,225 | $1.12 | 3d | 1 | 0.87mi |
| 2028 S 81st St West Allis, WI | 2.0 | 1.0 | 930 | $1,600 | $1.72 | 23d | 1 | 0.87mi |
| 2640 S 69th St #2642 Milwaukee, WI | 2.0 | 1.0 | 1200 | $1,549 | $1.29 | 43d | 1 | 0.88mi |
| 8530 W National Ave West Allis, WI | 1.0–3.0 | 1.0–2.0 | 1037 | $3,050 | $2.94 | 1d | 6 | 1.00mi |
| 3541 S 92nd St Unit NA Milwaukee, WI | 2.0 | 1.0 | 700 | $1,500 | $2.14 | 43d | 1 | 1.20mi |
| 3541 S 92nd St Milwaukee, WI | 2.0 | 1.0 | 700 | $1,500 | $2.14 | 17d | 1 | 1.20mi |
| 1501 S 84th St Unit 8405 Upper West Allis, WI | 2.0 | 1.0 | 950 | $1,195 | $1.26 | 3d | 1 | 1.31mi |
| 1482 S 84th St Milwaukee, WI | 1.0–2.0 | 1.0–2.0 | 1082 | $2,500 | $2.31 | 1d | 32 | 1.35mi |
| 1732 S 71st St Unit 1732 West Allis, WI | 3.0 | 1.0 | 912 | $1,795 | $1.97 | 12d | 1 | 1.36mi |
| 1553 S 75th St Unit 1553 West Allis, WI | 2.0 | 1.0 | 1008 | $1,595 | $1.58 | 3d | 1 | 1.39mi |
| 1467 S 78th St Milwaukee, WI | 2.0 | 1.0 | 1000 | $1,500 | $1.50 | 12d | 1 | 1.42mi |
| 1427 S 86th St West Allis, WI | 3.0 | 1.0 | 998 | $1,399 | $1.40 | 12d | 1 | 1.45mi |
| 6901 W Mitchell St Unit 6903 West Allis, WI | 2.0 | 1.0 | 800 | $945 | $1.18 | 3d | 1 | 1.45mi |
| 6901 W Mitchell St Unit 6903 West Allis, WI | 2.0 | 1.0 | 800 | $1,150 | $1.44 | 23d | 1 | 1.45mi |
Listing history 7 events
-
2026-05-12status Pending
-
2026-05-01price $190,900
-
2026-05-01status Active
-
2026-04-24status Pending
-
2026-03-12$194,900 Active
-
2025-03-25historical
-
2025-02-13$160,000 Active
ⓘ Source: listings_history table (triggers on properties + properties_extension) + one-shot
backfill from property_details.listing_events for pre-trigger history.
Climate risk First Street
- Flood 1/10 Low FEMA zone X (unshaded) · 0% chance over 30 yrs
- Wildfire 1/10 Low
- Heat 2/10 Low 7 d/yr ≥99°F today · 12 d/yr by 30 yrs out
- Wind 2/10 Low
- Air quality 2/10 Low 1 unhealthy d/yr today · 1 by 30 yrs out
Nearby sold comps map
Loading sold comps map…
Walkable amenities ~0.75 mi
Loading nearby amenities…
Taxation est. · year 1
- Rental income
- $31,812
- − Mortgage interest
- −$10,693
- − Property taxes
- −$2,864
- − Insurance
- −$954
- − Repairs & maintenance
- −$2,545
- − Management
- −$2,545
- − Depreciation
- −$5,553
- Taxable income
- $6,657
- Est. tax owed @ 24.0%
- −$1,598
- After-tax cash flow
- $7,703/yr
For passive investors: Depreciation is non-cash, so a rental often shows a tax loss while cash-flowing — sheltering income. Rental losses are passive: they offset passive income freely, and up to $25,000/yr can offset ordinary (W-2) income if you actively participate and your MAGI is under $100k (phasing out to $0 by $150k); unused losses carry forward. On sale, claimed depreciation is recaptured at up to 25%, and gains may owe capital-gains tax (a 1031 exchange can defer both). Figures are a year-1 estimate at your 24.0% rate — not tax advice; consult a CPA.
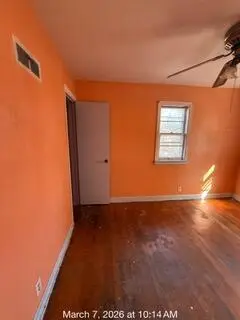
Condition & rehab AI · 1 photo
This multi-family property requires extensive repairs and updates, including painting, flooring replacement, and new windows, to bring it up to a move-in-ready condition.
Repairs flagged
- Major Paint — Peeling paint on interior walls
- Major Flooring — Worn hardwood flooring
- Major Windows — No windows visible, may need replacement
Value-add opportunities
- Both Paint interior walls — Fresh paint enhances curb appeal and interior aesthetics
- Both Replace flooring — New flooring improves living space and adds value
- Both Install new windows — New windows improve energy efficiency and curb appeal
Renovation cost estimate screening
| Repair item | Severity | Est. cost |
|---|---|---|
| Paint · Peeling paint on interior walls | Major | $15,000–50,000 |
| Flooring · Worn hardwood flooring | Major | $15,000–50,000 |
| Windows · No windows visible, may need replacement | Major | $15,000–50,000 |
| Total estimated repair cost · 3 items | $45,000–150,000 |
Value-add ROI direction
- Both Paint interior walls — Fresh paint enhances curb appeal and interior aesthetics ↑
- Both Replace flooring — New flooring improves living space and adds value ↑
- Both Install new windows — New windows improve energy efficiency and curb appeal ↑
ⓘ Cost ranges are severity-bucket heuristics (US national rule-of-thumb). Get contractor quotes + a written scope before underwriting a rehab budget.
Schools (NCES district)
- District
- West Allis-West Milwaukee School District
- NCES district ID
- 5516260
- Math proficiency
- 17% ▼ -16.00%
- Reading proficiency
- 26% ▼ -12.00%
- Median HH income
- $45,620
- Composite
- 18.71/100
- National rank
- #8881
- State rank
- #328 of 342 in WI
Livability — West Allis
- Score
- 79/100
- State rank
- #69
- US rank
- #1958
Category grades
Schools grade is shown separately in the Schools card above.
Census & demographics
- Census place
- West Allis, WI
- County
- Milwaukee County · 926,379 people
- City population
- 57,365
- Metro
- Milwaukee-Waukesha, WI
- Population (ZIP)
- 34,764
- Household income
- $70,388
- Rent vs Own
- Severe rent burden
- 902.0
Population outlook (Milwaukee County) Hauer SSP2
- Today (2025)
- 995,758 people
- By 2030
- 1,009,124 · +1.3%
- By 2040
- 1,028,128 · +3.3%
- By 2050
- 1,040,066 · +4.4%
- By 2075
- 1,057,849 · +6.2%
- By 2100
- 1,039,774 · +4.4%
Race, ethnicity, and origin ACS 2023
- Neighborhood character
- Diverse neighborhood (Simpson 0.56)
- Race & ethnicity
- White 59% Hispanic / Latino 31% Two or more races 16% Black 5% Asian 3% Native American 1%
- Hispanic origin (detail)
- Mexican 22% Puerto Rican 7%
- Common ancestry
- Romanian 12% Portuguese 3% Lithuanian 3%
- Foreign-born
- 10% · Canada, Philippines, China
- Languages at home
- 77% English-only · Spanish 19% Other Asian/Pacific 2%
Political lean MEDSL · Milwaukee
- 2024 margin
- Solid D (+38.5) · D 68.3% · R 29.8% · Other 1.8%
- 2008→2024 swing
- +2.7pp toward D · 2008: 35.9pp · 2024: 38.5pp
- All cycles
- 2024: D+38.5 2020: D+39.9 2016: D+37.5 2012: D+34.6 2008: D+35.9
Not yet ingested
- Civics
- —
Market trends
- HPI YoY
- ▼ -118.46%
- Current HPI
- 278.8314
- Rent YoY
- ▲ 5.09%
- Metro
- Milwaukee-Waukesha, WI
- State GDP YoY
- ▲ 2.10%
- F500 in state
- 20
Industry mix (Fortune 500 HQ in WI)
| Industry | F500 HQs | Revenue |
|---|---|---|
| Industrial Machinery | 4 | $23B |
|
||
| Industrial Technology | 2 | $36B |
|
||
| Insurance | 1 | $36B |
|
||
| Professional Services | 1 | $19B |
|
||
| Utilities | 1 | $9B |
|
||
| Consumer Goods | 1 | $3B |
|
||
Price history
+19.3% since first listed7 events — show timeline
- 2026-05-12 Pending — METROMLS
- 2026-05-01 Price Changed $190,900 METROMLS
- 2026-05-01 Relisted — METROMLS
- 2026-04-24 Pending — METROMLS
- 2026-03-12 Listed $194,900 METROMLS
- 2025-03-25 Listing Removed — METROMLS
- 2025-02-13 Listed $160,000 METROMLS
Cash-flow waterfall
monthlySold comps — $/sqft
last 12 mo · ≤1 miLoading sold comps…