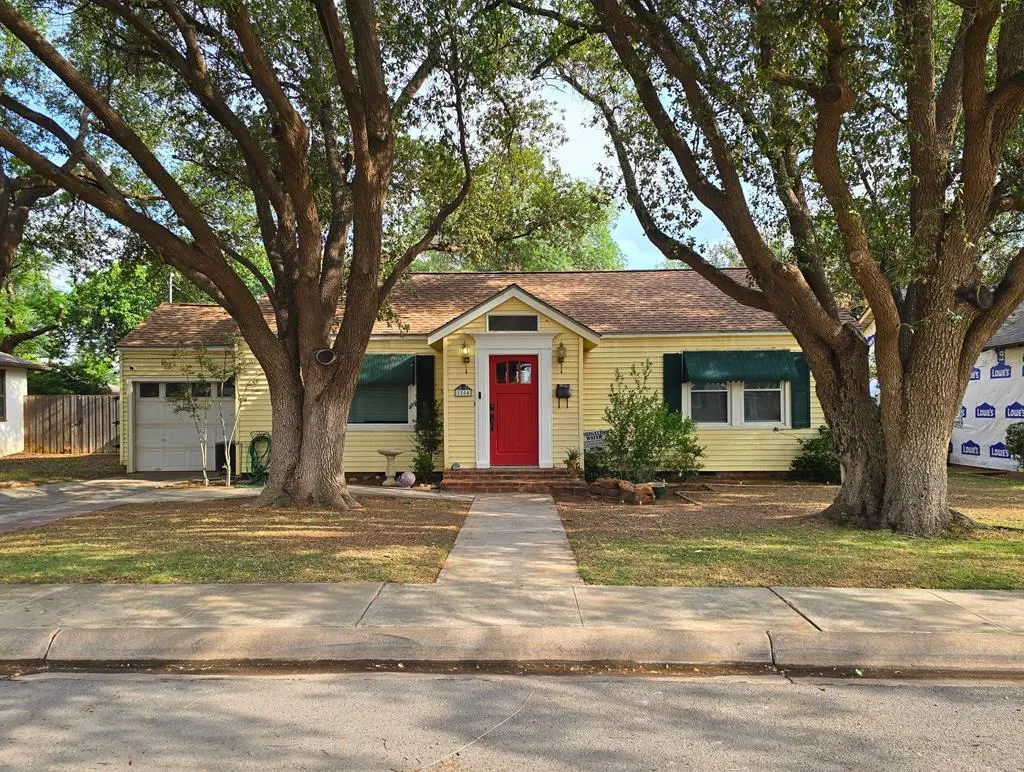
1804 W Tennessee Ave
Midland, TX 79701
$215,000D
3 bd · 2.0 ba ·
1,320 sqft ·
Built 1948
· SingleFamily
· Pending
· 13 DOM
Cashflow @ list (25.0% down · 7.5%)
Estimated rent
$1,960/mo
Mortgage (P&I)
−$1,127
Tax + insurance
−$356
HOA
−$0
Vac / Maint / Mgmt
−$412
Net cashflow
$64/mo
Annual
$771/yr
Cap rate
6.65%
Cash-on-cash
1.28%
DSCR
1.06
1% rule
0.91%
Cash to close
$60,200
Investor read
- This is a 3-bed/2.0-bath single-family listed at $215k.
- At list price, monthly cash flow is $64 ($771/yr) — positive.
- The deal already cash-flows at list — no discount required.
- To meet the 1% rule (rent ≥ 1% of price), the offer needs to be $196k (8.8% below list).
- Only 13 days on market — expect competitive offers; lowballing is unlikely to land.
- Recommended offer: $196k (8.8% below list) — sets the bar for 1% rule.
- Local home prices are declining (-3.0%/yr); year-one equity from $1k of loan paydown is wiped out by about $6k of value loss. Plan a longer hold.
- Location reads 79/100 on livability (#57 in TX, #2,192 nationally) — a middle-class / working-renter tenant base. Strengths: employment A+, housing A+, health & safety A+; Watch: crime C-, commute D+, amenities D.
- Midland ISD (urban): math 34% / reading 36% proficiency, ranked #477 of 826 in TX (top 58%) — families likely to look elsewhere, expect single-tenant / working-renter base with shorter leases.
- Zoned schools: Sam Houston Collegiate Preparatory El (math 37% / reading 42%, grade F, #1,545 of 4,322 statewide, top 38%, 469 students, 64% FRL, charter); San Jacinto J H (math 26% / reading 35%, grade F, #1,036 of 1,662 statewide, top 63%, 829 students, 54% FRL); Midland H S (math 37% / reading 7%, grade F, #1,366 of 1,632 statewide, top 84%, 2,492 students, 44% FRL) — zoned schools at 54% FRL track the district average.
- Watch-outs: built in 1948 — expect roof / HVAC / electrical / plumbing capex.
- Market conditions: Rents flat; 113 active listings in the ZIP; 32 comparable units currently listed for rent nearby; rentals lingering (median 44d on market — plan ~5-8 weeks vacancy on turnover, expect pricing pressure); 53% of comp listings sitting > 30 days — soft ceiling on asking rent; 1,504 units permitted in Midland County in 2024 (0 in 5+ unit buildings).
- Midland County population projected at +83% by 2050 — long-run rental-demand tailwind backs the buy-and-hold thesis.
- Climate carrying-cost: extreme-heat days projected 7→21/yr by 2055 (HVAC capex compounding) — expect insurance premiums to compound above CPI over the hold.
- Cap rate 6.7% vs local median 4.7% in Midland — top-decile yield for the area; either an underpriced asset or a hidden risk that comps aren't pricing in. Stress-test before assuming the spread holds.
- This rent runs 41% of the median local income ($57k/yr) — at the standard rent-burdened threshold; future hikes will face affordability resistance.
Questions for listing agent
- Built in 1948 — when were the roof, HVAC, electrical panel, plumbing, and water heater last replaced?
- Is there a deadline driving the sale (1031 exchange, divorce, estate, relocation)? That informs how much negotiation room exists.
- The area grade is low — what's the realistic commute time and amenity access for the typical tenant pool here? Any planned neighborhood developments (good or bad) we should know about?
- What's the average days-on-market for RENTAL listings here right now (not sales)? A rising rental-DOM trend means longer vacancies and softer asking-rent achievability than the comps imply.
- What's the recent tenant-quality profile in this submarket — average credit score on applications, eviction rate, late-payment / NSF rate, and stable-employment percentage? A property-management company in the area should have these aggregated.
- How much new for-sale + rental construction is in the pipeline within 1–3 miles? Heavy new supply typically softens prices + rents 12–24 months out; constrained supply supports both.
CashFlowRE · CFR-2BPGEVFDK5GA6R
· Data 4 days ago
cashflowre.app · 2026-05-29