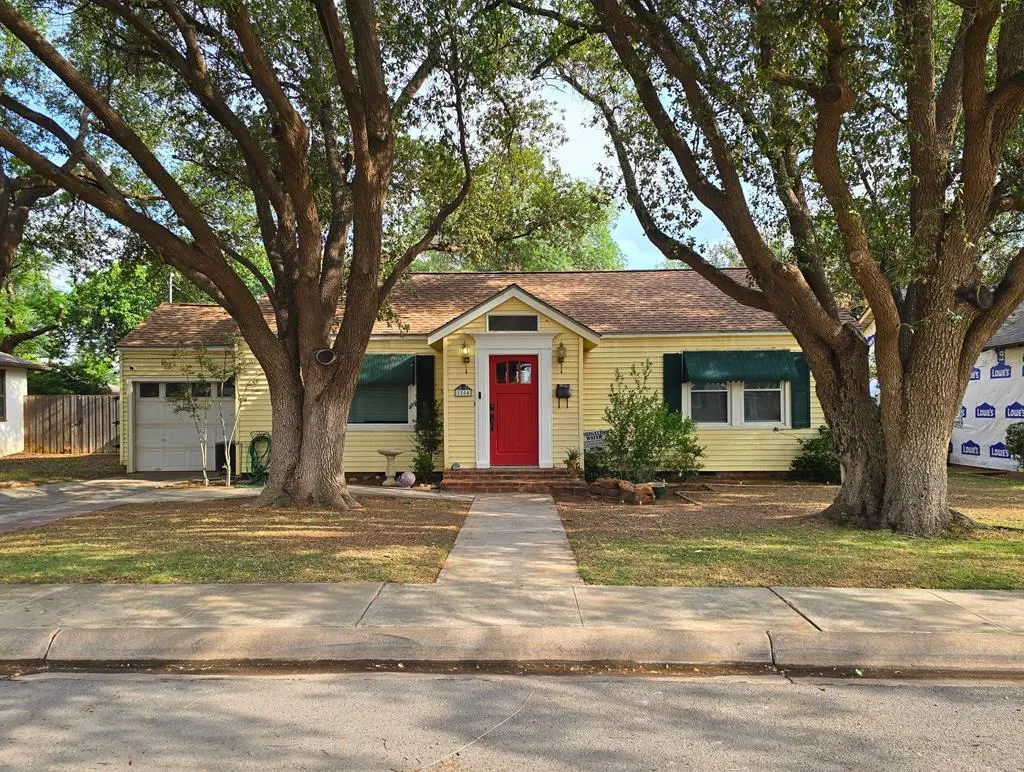
1804 W Tennessee Ave · Midland, TX
Flood risk 1/10 · Minimal
- FEMA flood zone
- X
- Chance of flooding over 30 yrs
- 0.0%
- Est. flood insurance / yr
- $507 – $1,088
Fire risk 1/10 · Minimal
- Est. fire insurance / yr
- $1,222 – $2,270
Heat risk 6/10 · Moderate
- Hot days now (above 102°F)
- 7 days/yr
- Hot days in 30 yrs
- 21 days/yr
Wind risk 2/10 · Minimal
- Chance of severe wind over 30 yrs
- 3.0%
Air-quality risk 1/10 · Minimal
- Unhealthy air days now
- 0 days/yr
- Unhealthy air days in 30 yrs
- 0 days/yr
Risk factors via First Street. Map © Google.
Why this score? — see what drove the D grade
The composite is a weighted blend of 9 inputs, each scored 0–100. Each bar is that input's sub-score; the figure is the points it added to the 100-point composite (weight × sub-score).
- Cash flow +14.9/30.0
- ARV discount +7.5/15.0
- DSCR +4.6/10.0
- 1% rule +4.1/10.0
- Livability +4.0/5.0
- Schools +3.2/10.0
- Rent growth +2.7/5.0
- Condition / age +2.5/5.0
- Appreciation +0.0/10.0
$215,000
🖨 Deal sheet 📄 Offer letter ✓ Due diligence
Listing remarks
Charming Old Midland 3 bed, 2 bath home filled with character and timeless appeal. Inviting curb appeal, mature landscaping, hardwood floors, crown molding, built-ins, and abundant natural light throughout. Spacious living area opens to the dining room and kitchen featuring ample storage, a vintage white stove, and backyard views. Primary suite offers a walk-in closet and private bath. Large laundry room, carport, sprinkler system, water well, and expansive backyard. Conveniently located near downtown, the hospital, stadium, shopping, dining, and schools.
Key facts
- Natural light
- Mature landscaping
- Crown molding
Tags
Property features AI
Finance
- Other: Lot approximately 0.209 acres
Exterior
- Parking: Detached carport; 2 carport spaces
- Security: Security system; Smoke detectors
- Utilities: Public water (also lists well/private); Public sewer
- Home design: Single-family residence; One story; Residential property
- Construction: Composition roof; Slab foundation
- Exterior features: Covered patio; Deck; Wood fencing
Interior
- Kitchen: Electric range; Range
- Flooring: Hardwood; Tile; Vinyl
- Bathrooms: 2 full bathrooms
- Heating & cooling: Central heating; Central air conditioning; Ceiling fans
- Interior features: Built-in bookcases
- Laundry & utility: Gas water heater
Neighborhood map
What this means for you Summary
Snapshot
- This is a 3-bed/2.0-bath single-family listed at $215k.
Deal economics
- At list price, monthly cash flow is $64 ($771/yr) — positive.
- The deal already cash-flows at list — no discount required.
- To meet the 1% rule (rent ≥ 1% of price), the offer needs to be $196k (8.8% below list).
- Recommended offer: $196k (8.8% below list) — sets the bar for 1% rule.
- Cap rate 6.7% vs local median 4.7% in Midland — top-decile yield for the area; either an underpriced asset or a hidden risk that comps aren't pricing in. Stress-test before assuming the spread holds.
Location & tenants
- Location reads 79/100 on livability (#57 in TX, #2,192 nationally) — a middle-class / working-renter tenant base. Strengths: employment A+, housing A+, health & safety A+; Watch: crime C-, commute D+, amenities D.
- Midland ISD (urban): math 34% / reading 36% proficiency, ranked #477 of 826 in TX (top 58%) — families likely to look elsewhere, expect single-tenant / working-renter base with shorter leases.
- Zoned schools: Sam Houston Collegiate Preparatory El (math 37% / reading 42%, grade F, #1,545 of 4,322 statewide, top 38%, 469 students, 64% FRL, charter); San Jacinto J H (math 26% / reading 35%, grade F, #1,036 of 1,662 statewide, top 63%, 829 students, 54% FRL); Midland H S (math 37% / reading 7%, grade F, #1,366 of 1,632 statewide, top 84%, 2,492 students, 44% FRL) — zoned schools at 54% FRL track the district average.
- Market conditions: Rents flat; 113 active listings in the ZIP; 32 comparable units currently listed for rent nearby; rentals lingering (median 44d on market — plan ~5-8 weeks vacancy on turnover, expect pricing pressure); 53% of comp listings sitting > 30 days — soft ceiling on asking rent; 1,504 units permitted in Midland County in 2024 (0 in 5+ unit buildings).
- This rent runs 41% of the median local income ($57k/yr) — at the standard rent-burdened threshold; future hikes will face affordability resistance.
Forward outlook
- Local home prices are declining (-3.0%/yr); year-one equity from $1k of loan paydown is wiped out by about $6k of value loss. Plan a longer hold.
- Midland County population projected at +83% by 2050 — long-run rental-demand tailwind backs the buy-and-hold thesis.
Negotiation context
- Only 13 days on market — expect competitive offers; lowballing is unlikely to land.
Risks & watch-outs
- Watch-outs: built in 1948 — expect roof / HVAC / electrical / plumbing capex.
- Climate carrying-cost: extreme-heat days projected 7→21/yr by 2055 (HVAC capex compounding) — expect insurance premiums to compound above CPI over the hold.
Questions for the listing agent
- Built in 1948 — when were the roof, HVAC, electrical panel, plumbing, and water heater last replaced?
- Is there a deadline driving the sale (1031 exchange, divorce, estate, relocation)? That informs how much negotiation room exists.
- The area grade is low — what's the realistic commute time and amenity access for the typical tenant pool here? Any planned neighborhood developments (good or bad) we should know about?
- What's the average days-on-market for RENTAL listings here right now (not sales)? A rising rental-DOM trend means longer vacancies and softer asking-rent achievability than the comps imply.
- What's the recent tenant-quality profile in this submarket — average credit score on applications, eviction rate, late-payment / NSF rate, and stable-employment percentage? A property-management company in the area should have these aggregated.
- How much new for-sale + rental construction is in the pipeline within 1–3 miles? Heavy new supply typically softens prices + rents 12–24 months out; constrained supply supports both.
Investment metrics
- 1% rule
- 0.91% ✗
- Cap rate
- 6.65%
- Cash-on-cash
- 1.28%
- DSCR
- 1.06
- GRM
- 9.1
CMA / ARV
- ARV (on-the-fly)
- $215,160
- Comps found
- 1
Show comp detail 1 sale within ~0.75 mi
| Address | Dist | Beds/Ba | Sqft | Sold | Price | $/sf | Match |
|---|---|---|---|---|---|---|---|
| 1305 W Kentucky Ave | 0.72mi | 3/1.5 | 1,331 (+1%) | 6mo | $217,500 | $163 | 58 |
Match score weights: distance 35% · size 25% · config 20% · recency 20%. Top-matched comps best support the ARV.
Projected returns pro-forma
-3.0% appreciation · 0.74% rent growth · sell at horizon
- IRR
- -16.8%
- Equity multiple
- 0.42×
- Total profit
- $-35,077
- Equity at exit
- $32,057
- IRR
- -13.4%
- Equity multiple
- 0.30×
- Total profit
- $-42,250
- Equity at exit
- $18,589
Cash invested: $60,200 (down + closing). Projections, not guarantees.
Landlord ↔ Tenant lean methodology
- Overall (STATE)
- 87 Strongly Landlord-Friendly
- State Texas
- 87 Strongly Landlord-Friendly · R+5
- County
- — inherits STATE
- City
- — inherits STATE
ZIP-level market 79701
- Rents YoY
- 0.7%
- Active inventory
- 113
- Price-to-rent
- 9.1×
Monthly cashflow live
- Estimated rent
- $1,960 high interval (Pro) →
- Mortgage (P&I)
- −$1,127
- Tax from tax record
- −$267 /mo · $3,202/yr
- Insurance
- −$90
- HOA
- −$0
- Vacancy / Maint / Mgmt
- −$412
- Net cashflow
- $64
Break-even live
UW: 25.0% down · 7.5% · 30yr · 1.5% tax · 5.0% vac · 8.0% maint · 8.0% mgmt
Financing live
Cash to close
- Down payment
- $53,750
- Closing costs
- $6,450
- Reserves months
- —
- Total cash needed
- —
Loan-product check · same deal, 3 products live
Conventional
25% down · 7.5% · 30yr
- Down + closing
- —
- Monthly P&I
- —
- Monthly cashflow
- —
- DSCR
- —
- Eligible?
- —
Personal DTI + credit; lowest rate.
DSCR
20% down · 8.5% · 30yr
- Down + closing
- —
- Monthly P&I
- —
- Monthly cashflow
- —
- DSCR
- —
- Eligible?
- —
No personal income docs; deal must DSCR.
Hard money
10% down · 12.0% · 12mo
- Down + closing
- —
- Monthly P&I
- —
- Monthly cashflow
- —
- DSCR
- —
- Eligible?
- —
Short-term bridge; refi at stabilization.
Rent comps 32 comps
| Address | Beds | Baths | Sqft | Rent | $/sqft | DOM | Units | Dist |
|---|---|---|---|---|---|---|---|---|
| 1402 W Tennessee Ave Midland, TX | 2.0 | 1.0 | 1050 | $2,500 | $2.38 | 43d | 1 | 0.31mi |
| 2406 W Louisiana Ave Midland, TX | 2.0 | 1.5 | 1620 | $2,500 | $1.54 | 43d | 1 | 0.45mi |
| 1511 Bedford Dr Midland, TX | 3.0 | 2.0 | 1732 | $2,500 | $1.44 | 43d | 1 | 0.48mi |
| 705 Ainslee St Midland, TX | 3.0 | 2.0 | 1144 | $1,900 | $1.66 | 21d | 1 | 0.49mi |
| 1002 W Louisiana Ave Midland, TX | 2.0 | 1.5 | 1472 | $2,500 | $1.70 | 43d | 1 | 0.59mi |
| 1707 College Ave Midland, TX | 2.0 | 1.5 | 1760 | $1,900 | $1.08 | 21d | 1 | 0.65mi |
| 2805 W Louisiana Ave Midland, TX | 3.0 | 2.0 | 1178 | $2,400 | $2.04 | 21d | 1 | 0.71mi |
| 1807 W Kentucky Ave Midland, TX | 3.0 | 2.0 | 1696 | $2,800 | $1.65 | 21d | 1 | 0.73mi |
| 2901 W Louisiana Ave Unit 3 Midland, TX | 2.0 | 1.0 | 925 | $1,090 | $1.18 | 43d | 1 | 0.78mi |
| 2111 W Kentucky Ave Midland, TX | 2.0 | 1.0 | 981 | $1,400 | $1.43 | 21d | 1 | 0.80mi |
| 2704 Delano Ave Midland, TX | 3.0 | 1.0 | 1220 | $1,900 | $1.56 | 44d | 1 | 0.81mi |
| 2928 W Louisiana Ave Unit 216 Midland, TX | 2.0 | 1.0 | 950 | $1,050 | $1.11 | 43d | 1 | 0.82mi |
| 2928 W Louisiana Ave Unit 213 Midland, TX | 3.0 | 2.0 | 1450 | $1,400 | $0.97 | 43d | 1 | 0.82mi |
| 2928 W Louisiana Ave Unit 221 Midland, TX | 2.0 | 1.5 | 1000 | $1,200 | $1.20 | 43d | 1 | 0.82mi |
| 2928 W Louisiana Ave Midland, TX | 2.0 | 1.0 | 950 | $1,395 | $1.47 | 43d | 1 | 0.83mi |
| 2929 W Kansas Ave Midland, TX | 2.0 | 1.0 | 1050 | $1,200 | $1.14 | 43d | 1 | 0.83mi |
| 2929 W Kansas Ave Unit 317 Midland, TX | 2.0 | 1.5 | 1050 | $1,200 | $1.14 | 43d | 1 | 0.83mi |
| 2910 W Michigan Ave Unit 110 Midland, TX | 2.0 | 1.0 | 980 | $1,250 | $1.28 | 43d | 1 | 0.84mi |
| 2910 W Michigan Ave Unit 101 Midland, TX | 2.0 | 2.0 | 1215 | $1,350 | $1.11 | 43d | 1 | 0.84mi |
| 2910 W Michigan Ave Unit 110 Midland, TX | 2.0 | 1.0 | 980 | $1,250 | $1.28 | 13d | 1 | 0.84mi |
| 3007 W Louisiana Ave Midland, TX | 2.0 | 1.0 | 925 | $1,079 | $1.17 | 21d | 1 | 0.89mi |
| 2812 Mariana Ave Midland, TX | 3.0 | 1.5 | 1443 | $1,750 | $1.21 | 43d | 1 | 0.95mi |
| 1101 N Carrizo St Unit 6 Midland, TX | 2.0 | 1.0 | 915 | $1,500 | $1.64 | 13d | 1 | 0.97mi |
| 3105 Barkley Ave Midland, TX | 4.0 | 2.0 | 1730 | $2,350 | $1.36 | 13d | 1 | 1.00mi |
| 1513 Club Dr Midland, TX | 2.0 | 2.0 | 1502 | $2,300 | $1.53 | 21d | 1 | 1.00mi |
| 3100 Thomas Ave Midland, TX | 3.0 | 1.0 | 1300 | $2,400 | $1.85 | 43d | 1 | 1.01mi |
| 2705 W Kentucky Ave Midland, TX | 3.0 | 2.0 | 924 | $1,800 | $1.95 | 21d | 1 | 1.03mi |
| 1100 N Colorado St Unit NA Midland, TX | 3.0 | 2.0 | 1768 | $2,500 | $1.41 | 21d | 1 | 1.26mi |
| 3311 Storey Ave Midland, TX | 3.0 | 1.5 | 1100 | $1,700 | $1.55 | 13d | 1 | 1.37mi |
| 3403 Thomas Ave Midland, TX | 2.0 | 2.0 | 1472 | $2,000 | $1.36 | 13d | 1 | 1.44mi |
| 3401 Storey Ave Midland, TX | 3.0 | 2.0 | 1531 | $2,200 | $1.44 | 43d | 1 | 1.46mi |
| 3401 Storey Ave Midland, TX | 3.0 | 2.0 | 1531 | $2,200 | $1.44 | 21d | 1 | 1.46mi |
Listing history 10 events
-
2026-06-15status $215,000 Pending 13 DOM
-
2026-06-15days on market $215,000 Active Under Contract 13 DOM
-
2026-06-14days on market $215,000 Active Under Contract 11 DOM
-
2026-06-13days on market $215,000 Active Under Contract 10 DOM
-
2026-06-10days on market $215,000 Active Under Contract 8 DOM
-
2026-06-09days on market $215,000 Active Under Contract 7 DOM
-
2026-06-08days on market $215,000 Active Under Contract 6 DOM
-
2026-06-07statusdays on market $215,000 Active Under Contract 5 DOM
-
2026-06-03remarks 561-char remark
-
2026-06-03$215,000 Active 1 DOM
ⓘ Source: listings_history table (triggers on properties + properties_extension) + one-shot
backfill from property_details.listing_events for pre-trigger history.
Tax reassessment forecast TX · Resets to sale price
- Current annual tax
- $3,202 · $267/mo
- Projected year-2 tax
- $3,934 · $328/mo
- Expected delta
- +$732/yr (+$61/mo · 22.9%)
ⓘ Screening estimate from a state-policy table — verify with the county assessor before closing.
Climate risk First Street
- Flood 1/10 Low FEMA zone X · 0% chance over 30 yrs
- Wildfire 1/10 Low
- Heat 6/10 Major 7 d/yr ≥102°F today · 21 d/yr by 30 yrs out
- Wind 2/10 Low 3% chance of damaging wind over 30 yrs
- Air quality 1/10 Low 0 unhealthy d/yr today · 0 by 30 yrs out
Nearby sold comps map
Loading sold comps map…
Walkable amenities ~0.75 mi
Loading nearby amenities…
Taxation est. · year 1
- Rental income
- $23,517
- − Mortgage interest
- −$12,043
- − Property taxes
- −$3,202
- − Insurance
- −$1,075
- − Repairs & maintenance
- −$1,881
- − Management
- −$1,881
- − Depreciation
- −$6,255
- Taxable loss
- −$2,821
- Est. tax savings @ 24.0%
- +$677
- After-tax cash flow
- $1,448/yr
For passive investors: Depreciation is non-cash, so a rental often shows a tax loss while cash-flowing — sheltering income. Rental losses are passive: they offset passive income freely, and up to $25,000/yr can offset ordinary (W-2) income if you actively participate and your MAGI is under $100k (phasing out to $0 by $150k); unused losses carry forward. On sale, claimed depreciation is recaptured at up to 25%, and gains may owe capital-gains tax (a 1031 exchange can defer both). Figures are a year-1 estimate at your 24.0% rate — not tax advice; consult a CPA.
Schools (NCES district)
- District
- Midland ISD
- NCES district ID
- 4830570
- Math proficiency
- 34% ▼ -7.00%
- Reading proficiency
- 36% ▬ 0.00%
- Median HH income
- $63,457
- Composite
- 31.63/100
- National rank
- #5938
- State rank
- #477 of 826 in TX
Livability — Midland
- Score
- 79/100
- State rank
- #57
- US rank
- #2192
Category grades
Schools grade is shown separately in the Schools card above.
Census & demographics
- Census place
- Midland, TX
- County
- Midland County · 168,494 people
- City population
- 168,494
- Metro
- Midland, TX
- Population (ZIP)
- 27,131
- Household income
- $57,346
- Rent vs Own
- Severe rent burden
- 938.0
Population outlook (Midland County) Hauer SSP2
- Today (2025)
- 220,895 people
- By 2030
- 253,667 · +14.8%
- By 2040
- 325,498 · +47.4%
- By 2050
- 404,168 · +83.0%
- By 2075
- 609,802 · +176.1%
- By 2100
- 760,172 · +244.1%
Race, ethnicity, and origin ACS 2023
- Neighborhood character
- Diverse neighborhood (Simpson 0.55)
- Race & ethnicity
- Hispanic / Latino 61% Two or more races 28% White 27% Black 10%
- Hispanic origin (detail)
- Mexican 57%
- Common ancestry
- Lithuanian 1% Slovak 1% Ukrainian 1%
- Foreign-born
- 17% · Canada
- Languages at home
- 55% English-only · Spanish 44%
Political lean MEDSL · Midland
- 2024 margin
- Solid R (+60.5) · D 19.3% · R 79.8%
- 2008→2024 swing
- -3.3pp toward R · 2008: -57.3pp · 2024: -60.5pp
- All cycles
- 2024: R+60.5 2020: R+56.6 2016: R+55.2 2012: R+61.5 2008: R+57.3
Not yet ingested
- Civics
- —
Market trends
- HPI YoY
- ▼ -227.32%
- Current HPI
- 234.6111
- Rent YoY
- ▲ 0.74%
- Metro
- Midland, TX
- State GDP YoY
- ▲ 3.95%
- F500 in state
- 110
Industry mix (Fortune 500 HQ in TX)
| Industry | F500 HQs | Revenue |
|---|---|---|
| Energy | 16 | $1,198B |
|
||
| Technology | 5 | $198B |
|
||
| Engineering / Construction | 4 | $72B |
|
||
| Energy Services | 3 | $60B |
|
||
| Utilities | 3 | $41B |
|
||
| Healthcare | 2 | $330B |
|
||
Price history
4 events — show timeline
- 2026-06-02 Listed $215,000 PBBOR
- 2018-10-03 Sold (Public Records) — Public Records
- 2009-11-18 Sold (Public Records) — Public Records
- 2002-06-25 Sold (Public Records) — Public Records
Property tax history
+1.4%/yrLatest (2025): $3,202 · -4.7% YoY. Source: county tax records.
Cash-flow waterfall
monthlySold comps — $/sqft
last 12 mo · ≤1 miLoading sold comps…