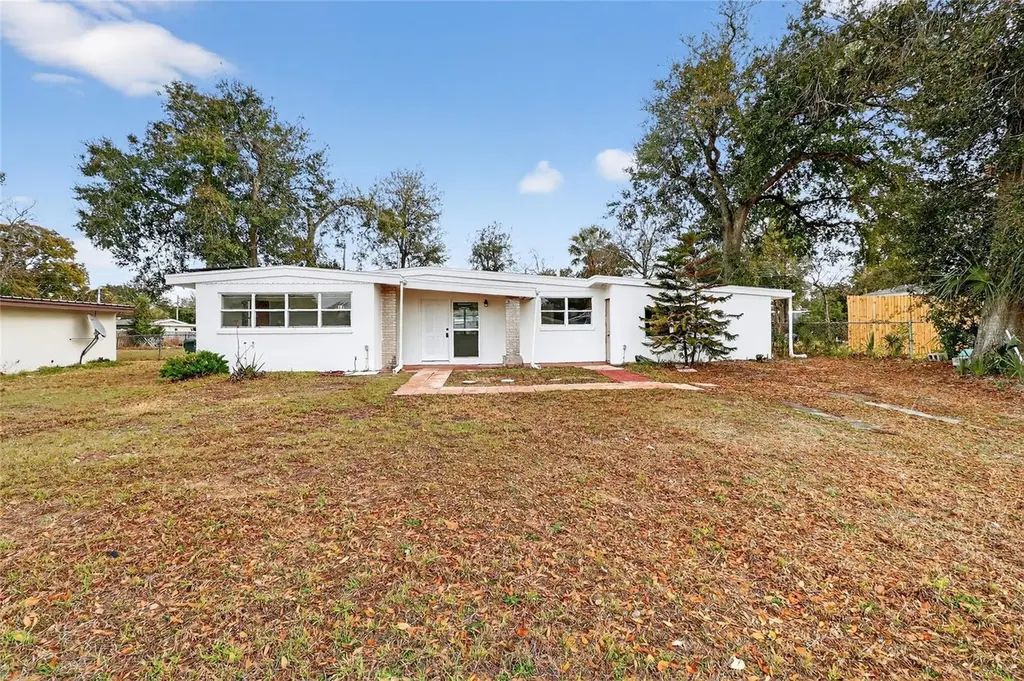
1319 Hillcrest Dr
Daytona Beach, FL 32114
$199,000D-
2 bd · 1.0 ba ·
1,297 sqft ·
Built 1953
· SingleFamily
· Active
· 131 DOM
Cashflow @ list (25.0% down · 7.5%)
Estimated rent
$1,613/mo
Mortgage (P&I)
−$1,044
Tax + insurance
−$294
HOA
−$0
Vac / Maint / Mgmt
−$339
Net cashflow
$-63/mo
Annual
$-761/yr
Cap rate
5.91%
Cash-on-cash
-1.37%
DSCR
0.94
1% rule
0.81%
Cash to close
$55,720
Investor read
- This is a 2-bed/1.0-bath single-family listed at $199k.
- At list price, monthly cash flow is $-63 ($-761/yr) — negative.
- To cash-flow at today's rent, offer at most $188k (5.6% below list).
- To meet the 1% rule (rent ≥ 1% of price), the offer needs to be $161k (18.9% below list).
- It's been on market 131 days — a 12% lower offer ($175k) is reasonable based on typical stale-listing flexibility.
- Recommended offer: $161k (18.9% below list) — sets the bar for 1% rule.
- Local home prices are declining (-3.0%/yr); year-one equity from $1k of loan paydown is wiped out by about $6k of value loss. Plan a longer hold.
- Location reads 83/100 on livability (#46 in FL, #867 nationally) — a professional / high-income tenant draw. Strengths: amenities A+, commute A+, cost of living A+; Watch: schools D+, employment D-.
- Volusia (suburban): math 44% / reading 49% proficiency, ranked #47 of 73 in FL (top 64%) — families likely to look elsewhere, expect single-tenant / working-renter base with shorter leases.
- Watch-outs: built in 1953 — expect roof / HVAC / electrical / plumbing capex.
- Market conditions: Rents rising (+3.6%/yr); 310 active listings in the ZIP; 26 comparable units currently listed for rent nearby; rentals at typical pace (median 24d on market — plan ~3-4 weeks tenant-placement turnaround); lower-income renter base — watch delinquency; 3,402 units permitted in Volusia County in 2024 (681 in 5+ unit buildings).
- Volusia County population projected at +19% by 2050 — long-run rental-demand tailwind backs the buy-and-hold thesis.
- 2 sale attempts; this cycle's ask is 5% above the opening price — seller raised mid-cycle; expect resistance to lowballs.
- Current owner paid $100k; list at $199k implies a 99% gain — meaningful room to come down on a strong offer.
- Climate carrying-cost: severe wind risk, 99% chance of damaging wind over 30y; extreme-heat days projected 7→21/yr by 2055 (HVAC capex compounding) — expect insurance premiums to compound above CPI over the hold.
- At $1,613/mo this rent would consume 46% of the median local household income ($42k/yr) (locally 2772% of renters already pay >50% of income on rent) — very limited rent-growth headroom before tenants either downsize or default.
Questions for listing agent
- What do current leases actually rent for vs. the listed asking? Can we see a recent rent roll and the last 12 months of T-12 income?
- It's been on market 131 days. Have you received any prior offers? Is the seller open to a 19% concession, seller financing, or rate buy-down credit?
- Built in 1953 — when were the roof, HVAC, electrical panel, plumbing, and water heater last replaced?
- Why hasn't it sold? Are there any deal-killer items the seller is aware of (foundation, flood, title, zoning, code violations)?
- Is there a deadline driving the sale (1031 exchange, divorce, estate, relocation)? That informs how much negotiation room exists.
- Schools are D-rated, which usually means shorter tenancies and higher turnover. Who's the typical renter profile here, and what's been the actual vacancy rate?
- The area grade is low — what's the realistic commute time and amenity access for the typical tenant pool here? Any planned neighborhood developments (good or bad) we should know about?
- What's the average days-on-market for RENTAL listings here right now (not sales)? A rising rental-DOM trend means longer vacancies and softer asking-rent achievability than the comps imply.
CashFlowRE · CFR-2CVZWKFW3ACQT4
· Data 2 weeks ago
cashflowre.app · 2026-05-29