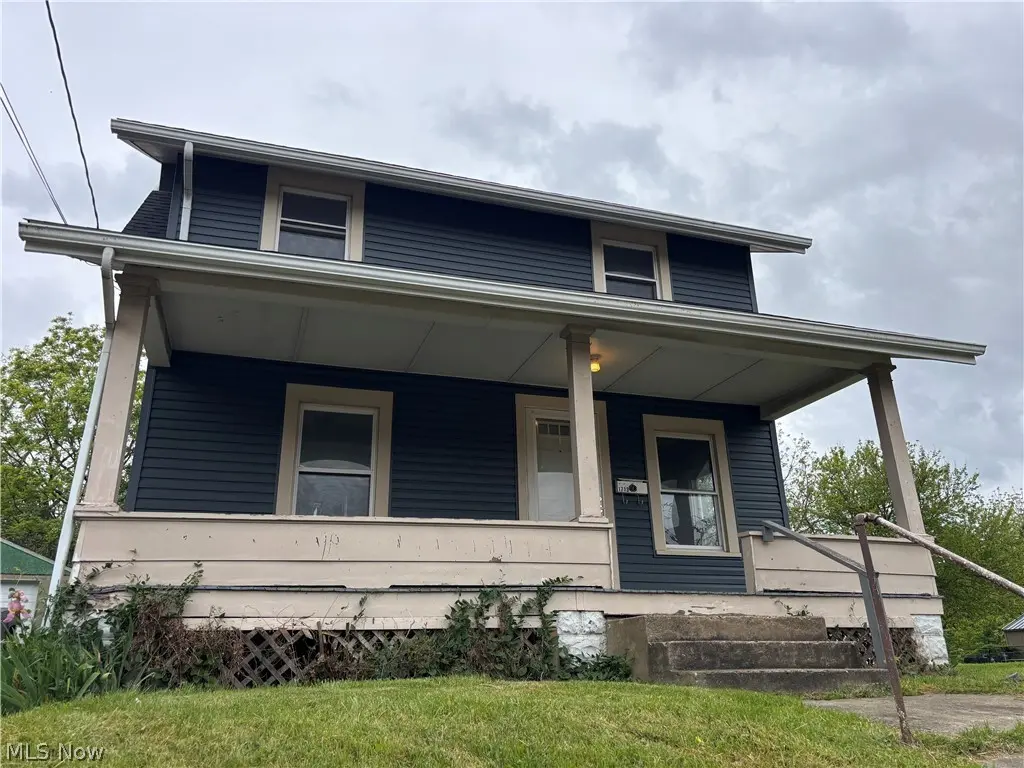
1713 Regal Ave NE
Canton, OH 44705
$89,900B-
3 bd · 1.0 ba ·
1,160 sqft ·
Built 1924
· SingleFamily
· Active
· 34 DOM
Cashflow @ list (25.0% down · 7.5%)
Estimated rent
$1,094/mo
Mortgage (P&I)
−$471
Tax + insurance
−$122
HOA
−$0
Vac / Maint / Mgmt
−$230
Net cashflow
$271/mo
Annual
$3,247/yr
Cap rate
9.90%
Cash-on-cash
12.90%
DSCR
1.57
1% rule
1.22%
Cash to close
$25,172
Investor read
- This is a 3-bed/1.0-bath single-family listed at $90k.
- At list price, monthly cash flow is $271 ($3k/yr) — positive.
- The deal already cash-flows at list — no discount required.
- Meets the 1% rule at list price ($1k rent vs $90k).
- It's been on market 34 days — a 3% lower offer ($87k) is reasonable based on typical stale-listing flexibility.
- Recommended offer: $87k (3.0% below list) — sets the bar for market timing.
- Local home prices are declining (-3.0%/yr); year-one equity from $622 of loan paydown is wiped out by about $3k of value loss. Plan a longer hold.
- Location reads 71/100 on livability (#441 in OH) — a middle-class / working-renter tenant base. Strengths: commute A+, cost of living A+, housing A; Watch: crime F, employment F.
- Canton City (urban): math 17% / reading 26% proficiency, ranked #627 of 656 in OH (top 96%) — low school quality limits family demand, transient renter base, plan for 1-2y turnover; 76% free/reduced lunch — lower-income household profile, screen leases tightly.
- Watch-outs: built in 1924 — expect roof / HVAC / electrical / plumbing capex.
- Market conditions: Rents soft (-0.2%/yr); 71 active listings in the ZIP; 11 comparable units currently listed for rent nearby; rentals at typical pace (median 21d on market — plan ~3-4 weeks tenant-placement turnaround); lower-income renter base — watch delinquency; 528 units permitted in Stark County in 2024 (84 in 5+ unit buildings).
- Stark County population projected to shrink 8% by 2050 — rents likely to lag national; underwrite the cash flow, not the appreciation.
- 6 sale attempts since 31y ago; this cycle's ask has dropped $5k (5%) from the opening price — seller is motivated, your offer sets the floor, not the list.
- Current owner paid $62k; 44% above their basis — modest negotiation headroom, anchor on the comps not their cost.
- Cap rate 9.9% vs local median 5.1% in Canton — top-decile yield for the area; either an underpriced asset or a hidden risk that comps aren't pricing in. Stress-test before assuming the spread holds.
- This rent runs 30% of the median local income ($43k/yr) — at the standard rent-burdened threshold; future hikes will face affordability resistance.
Questions for listing agent
- It's been on market 34 days. Have you received any prior offers? Is the seller open to a 3% concession, seller financing, or rate buy-down credit?
- Built in 1924 — when were the roof, HVAC, electrical panel, plumbing, and water heater last replaced?
- Is there a deadline driving the sale (1031 exchange, divorce, estate, relocation)? That informs how much negotiation room exists.
- Crime grade is F in this area — have there been break-ins, vandalism, or insurance claims at this property in the last 3 years? What carrier currently insures it and at what premium?
- What's the average days-on-market for RENTAL listings here right now (not sales)? A rising rental-DOM trend means longer vacancies and softer asking-rent achievability than the comps imply.
- What's the recent tenant-quality profile in this submarket — average credit score on applications, eviction rate, late-payment / NSF rate, and stable-employment percentage? A property-management company in the area should have these aggregated.
- How much new for-sale + rental construction is in the pipeline within 1–3 miles? Heavy new supply typically softens prices + rents 12–24 months out; constrained supply supports both.
CashFlowRE · CFR-2GXCTS0PYF0VTH
· Data 2 days ago
cashflowre.app · 2026-05-29