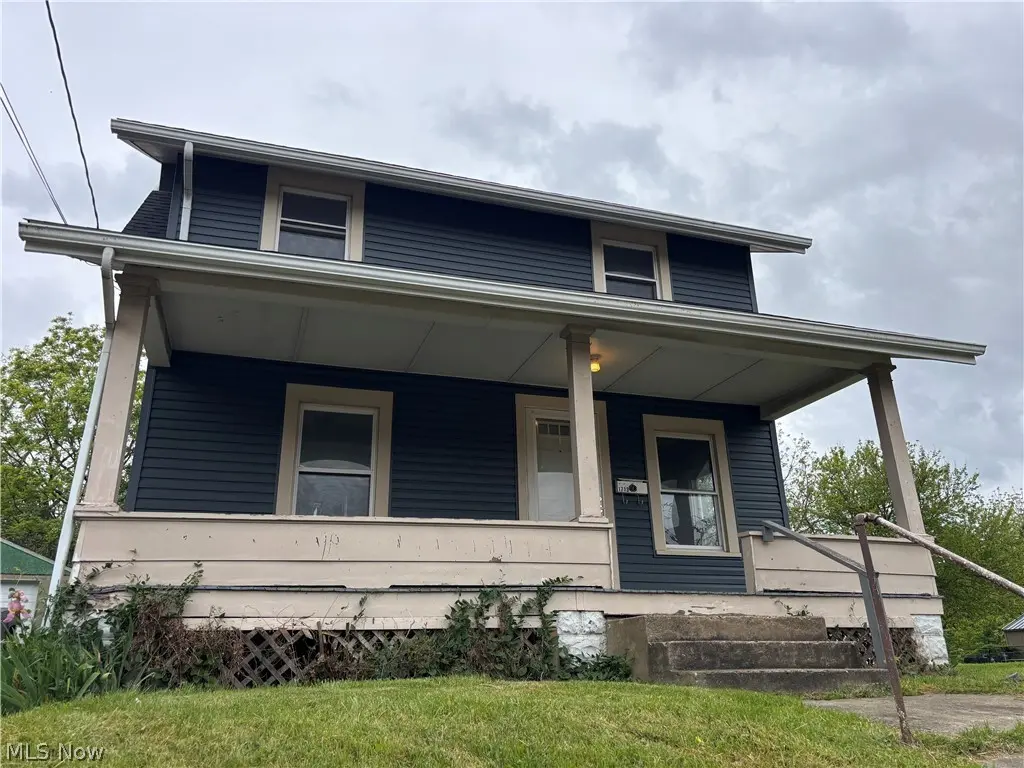
1713 Regal Ave NE · Canton, OH
Flood risk 1/10 · Minimal
- FEMA flood zone
- X (unshaded)
- Chance of flooding over 30 yrs
- 0.0%
- Est. flood insurance / yr
- $473 – $860
Fire risk 1/10 · Minimal
- Est. fire insurance / yr
- $713 – $1,323
Heat risk 3/10 · Minor
- Hot days now (above 96°F)
- 7 days/yr
- Hot days in 30 yrs
- 17 days/yr
Wind risk 1/10 · Minimal
- Chance of severe wind over 30 yrs
- —
Air-quality risk 2/10 · Minimal
- Unhealthy air days now
- 1 days/yr
- Unhealthy air days in 30 yrs
- 2 days/yr
Risk factors via First Street. Map © Google.
Why this score? — see what drove the B- grade
The composite is a weighted blend of 9 inputs, each scored 0–100. Each bar is that input's sub-score; the figure is the points it added to the 100-point composite (weight × sub-score).
- Cash flow +27.7/30.0
- ARV discount +12.4/15.0
- DSCR +9.7/10.0
- 1% rule +7.2/10.0
- Livability +3.6/5.0
- Condition / age +2.5/5.0
- Rent growth +2.4/5.0
- Schools +1.7/10.0
- Appreciation +0.0/10.0
$89,900
🖨 Deal sheet 📄 Offer letter ✓ Due diligence
Listing remarks MLS
Great investment. Kitchen has been updated. Proof of funds or pre-qual must be submitted w/ all offers. Sellers addendum can be printed from the MLS.
Key facts
- First-floor bedroom
- Fully updated roof
- Spacious living area
Tags
Property features AI
Exterior
- Parking: Shared driveway
- Utilities: Public water; Public sewer
- Home design: Two-story home
- Construction: Vinyl siding; Asphalt/fiberglass roof
- Exterior features: Shared driveway
Interior
- Kitchen: Kitchen on first floor
- Bedrooms: Main-level bedroom: 1; Second-floor bedrooms: 2; First-floor bedroom: 1
- Flooring: Ceramic tile in one bedroom; Carpet in two bedrooms, dining room, and family room; Laminate in kitchen
- Bathrooms: 1 full bathroom
- Heating & cooling: Forced-air gas heating
- Interior features: Full basement
Neighborhood map
What this means for you Summary
Snapshot
- This is a 3-bed/1.0-bath single-family listed at $90k.
Deal economics
- At list price, monthly cash flow is $271 ($3k/yr) — positive.
- The deal already cash-flows at list — no discount required.
- Meets the 1% rule at list price ($1k rent vs $90k).
- Recommended offer: $87k (3.0% below list) — sets the bar for market timing.
- Cap rate 9.9% vs local median 5.1% in Canton — top-decile yield for the area; either an underpriced asset or a hidden risk that comps aren't pricing in. Stress-test before assuming the spread holds.
Location & tenants
- Location reads 71/100 on livability (#441 in OH) — a middle-class / working-renter tenant base. Strengths: commute A+, cost of living A+, housing A; Watch: crime F, employment F.
- Canton City (urban): math 17% / reading 26% proficiency, ranked #627 of 656 in OH (top 96%) — low school quality limits family demand, transient renter base, plan for 1-2y turnover; 76% free/reduced lunch — lower-income household profile, screen leases tightly.
- Market conditions: Rents soft (-0.2%/yr); 71 active listings in the ZIP; 11 comparable units currently listed for rent nearby; rentals at typical pace (median 21d on market — plan ~3-4 weeks tenant-placement turnaround); lower-income renter base — watch delinquency; 528 units permitted in Stark County in 2024 (84 in 5+ unit buildings).
- This rent runs 30% of the median local income ($43k/yr) — at the standard rent-burdened threshold; future hikes will face affordability resistance.
Forward outlook
- Local home prices are declining (-3.0%/yr); year-one equity from $622 of loan paydown is wiped out by about $3k of value loss. Plan a longer hold.
- Stark County population projected to shrink 8% by 2050 — rents likely to lag national; underwrite the cash flow, not the appreciation.
Negotiation context
- It's been on market 34 days — a 3% lower offer ($87k) is reasonable based on typical stale-listing flexibility.
- 6 sale attempts since 31y ago; this cycle's ask has dropped $5k (5%) from the opening price — seller is motivated, your offer sets the floor, not the list.
- Current owner paid $62k; 44% above their basis — modest negotiation headroom, anchor on the comps not their cost.
Risks & watch-outs
- Watch-outs: built in 1924 — expect roof / HVAC / electrical / plumbing capex.
Questions for the listing agent
- It's been on market 34 days. Have you received any prior offers? Is the seller open to a 3% concession, seller financing, or rate buy-down credit?
- Built in 1924 — when were the roof, HVAC, electrical panel, plumbing, and water heater last replaced?
- Is there a deadline driving the sale (1031 exchange, divorce, estate, relocation)? That informs how much negotiation room exists.
- Crime grade is F in this area — have there been break-ins, vandalism, or insurance claims at this property in the last 3 years? What carrier currently insures it and at what premium?
- What's the average days-on-market for RENTAL listings here right now (not sales)? A rising rental-DOM trend means longer vacancies and softer asking-rent achievability than the comps imply.
- What's the recent tenant-quality profile in this submarket — average credit score on applications, eviction rate, late-payment / NSF rate, and stable-employment percentage? A property-management company in the area should have these aggregated.
- How much new for-sale + rental construction is in the pipeline within 1–3 miles? Heavy new supply typically softens prices + rents 12–24 months out; constrained supply supports both.
Investment metrics
- 1% rule
- 1.22% ✓
- Cap rate
- 9.90%
- Cash-on-cash
- 12.90%
- DSCR
- 1.57
- GRM
- 6.9
CMA / ARV
- ARV (median comp)
- $100,945
- List price
- $89,900
- Delta
- -10.94%
- Verdict
- UNDERPRICED
- Comps
- 20 within 1.0 mi
Show comp detail 12 sales within ~0.75 mi
| Address | Dist | Beds/Ba | Sqft | Sold | Price | $/sf | Match |
|---|---|---|---|---|---|---|---|
| 1604 Wooster Ave NE | 0.32mi | 3/1.0 | 1,162 (+0%) | 2mo | $90,000 | $77 | 83 |
| 2526 17th St NE | 0.04mi | 3/1.0 | 1,318 (+14%) | 5mo | $75,000 | $57 | 71 |
| 2212 Indiana Way NE | 0.36mi | 3/1.0 | 1,256 (+8%) | 1mo | $72,500 | $58 | 69 |
| 2107 Harrisburg Rd NE | 0.54mi | 3/1.0 | 1,152 (-1%) | 8mo | $59,000 | $51 | 67 |
| 1909 Gridley Ave NE | 0.21mi | 3/1.0 | 1,008 (-13%) | 7mo | $115,000 | $114 | 62 |
| 2735 19th St NE | 0.32mi | 3/1.0 | 1,008 (-13%) | 2mo | $84,000 | $83 | 62 |
| 2656 22nd St NE | 0.34mi | 3/1.0 | 1,008 (-13%) | 1mo | $25,000 | $25 | 61 |
| 1821 Wallace Ave NE | 0.66mi | 3/1.0 | 1,124 (-3%) | 5mo | $88,000 | $78 | 60 |
| 2005 17th St NE | 0.47mi | 3/1.0 | 1,040 (-10%) | 1mo | $144,100 | $139 | 60 |
| 2103 Bollinger Ave NE | 0.61mi | 3/1.0 | 1,250 (+8%) | 3mo | $105,900 | $85 | 56 |
| 2109 Willowrow Ave | 0.56mi | 3/1.0 | 1,067 (-8%) | 7mo | $135,000 | $127 | 55 |
| 2310 Willowrow Ave NE | 0.64mi | 3/1.0 | 1,008 (-13%) | 8mo | $135,000 | $134 | 41 |
Match score weights: distance 35% · size 25% · config 20% · recency 20%. Top-matched comps best support the ARV.
Projected returns pro-forma
-3.0% appreciation · 0.0% rent growth · sell at horizon
- IRR
- -0.6%
- Equity multiple
- 0.98×
- Total profit
- $-538
- Equity at exit
- $13,404
- IRR
- 5.8%
- Equity multiple
- 1.37×
- Total profit
- $9,336
- Equity at exit
- $7,773
Cash invested: $25,172 (down + closing). Projections, not guarantees.
Landlord ↔ Tenant lean methodology
- Overall (STATE)
- 73 Landlord-Friendly
- State Ohio
- 73 Landlord-Friendly · R+6
- County
- — inherits STATE
- City
- — inherits STATE
ZIP-level market 44705
- Rents YoY
- -0.2%
- Active inventory
- 71
- Price-to-rent
- 6.9×
Monthly cashflow live
- Estimated rent
- $1,094 high interval (Pro) →
- Mortgage (P&I)
- −$471
- Tax from tax record
- −$84 /mo · $1,012/yr
- Insurance
- −$37
- HOA
- −$0
- Vacancy / Maint / Mgmt
- −$230
- Net cashflow
- $271
Break-even live
UW: 25.0% down · 7.5% · 30yr · 1.5% tax · 5.0% vac · 8.0% maint · 8.0% mgmt
Financing live
Cash to close
- Down payment
- $22,475
- Closing costs
- $2,697
- Reserves months
- —
- Total cash needed
- —
Loan-product check · same deal, 3 products live
Conventional
25% down · 7.5% · 30yr
- Down + closing
- —
- Monthly P&I
- —
- Monthly cashflow
- —
- DSCR
- —
- Eligible?
- —
Personal DTI + credit; lowest rate.
DSCR
20% down · 8.5% · 30yr
- Down + closing
- —
- Monthly P&I
- —
- Monthly cashflow
- —
- DSCR
- —
- Eligible?
- —
No personal income docs; deal must DSCR.
Hard money
10% down · 12.0% · 12mo
- Down + closing
- —
- Monthly P&I
- —
- Monthly cashflow
- —
- DSCR
- —
- Eligible?
- —
Short-term bridge; refi at stabilization.
Rent comps 11 comps
| Address | Beds | Baths | Sqft | Rent | $/sqft | DOM | Units | Dist |
|---|---|---|---|---|---|---|---|---|
| 2213 17th St NE Canton, OH | 2.0 | 1.0 | 1132 | $1,100 | $0.97 | 44d | 1 | 0.31mi |
| 2103 Willowrow Ave NE Canton, OH | 3.0 | 1.0 | 850 | $1,000 | $1.18 | 13d | 1 | 0.55mi |
| 2321 Harmont Ave NE Canton, OH | 2.0 | 1.0 | 800 | $1,200 | $1.50 | 13d | 1 | 0.72mi |
| 2018 Maple Ave NE Canton, OH | 2.0 | 1.0 | 1206 | $950 | $0.79 | 13d | 1 | 0.75mi |
| 1524 Parkhill Pl NE Canton, OH | 3.0 | 1.0 | 856 | $995 | $1.16 | 43d | 1 | 0.94mi |
| 1206 Lawrence Rd NE Apt 3 Canton, OH | 2.0 | 1.0 | 900 | $950 | $1.06 | 20d | 1 | 1.31mi |
| 3045 Daleford Ave NE Canton, OH | 3.0 | 1.0 | 1300 | $1,059 | $0.81 | 20d | 1 | 1.35mi |
| 1906 6th St NE Unit 1906-002 Canton, OH | 3.0 | 1.0 | 906 | $1,000 | $1.10 | 13d | 1 | 1.37mi |
| 1613 Spring Ave NE Canton, OH | 3.0 | 1.0 | 1320 | $1,095 | $0.83 | 20d | 1 | 1.37mi |
| 1629 Spring Ave NE Unit Na Canton, OH | 2.0 | 1.0 | 1100 | $836 | $0.76 | 20d | 1 | 1.37mi |
| 1946 Otto Pl NE Canton, OH | 3.0 | 1.0 | 1499 | $28,000 | $18.68 | 13d | 1 | 1.48mi |
Listing history 31 events
-
2026-06-18days on market $89,900 Active 34 DOM
-
2026-06-17days on market $89,900 Active 33 DOM
-
2026-06-16days on market $89,900 Active 32 DOM
-
2026-06-15price $89,900 Active 31 DOM
-
2026-06-15days on market $94,900 Active 31 DOM
-
2026-06-14days on market $94,900 Active 29 DOM
-
2026-06-13days on market $94,900 Active 28 DOM
-
2026-06-10days on market $94,900 Active 26 DOM
-
2026-06-09days on market $94,900 Active 25 DOM
-
2026-06-08days on market $94,900 Active 24 DOM
-
2026-06-07days on market $94,900 Active 23 DOM
-
2026-06-05days on market $94,900 Active 20 DOM
-
2026-06-03days on market $94,900 Active 19 DOM
-
2026-06-02days on market $94,900 Active 18 DOM
-
2026-06-01days on market $94,900 Active 17 DOM
-
2026-05-31days on market $94,900 Active 16 DOM
-
2026-05-30days on market $94,900 Active 15 DOM
-
2026-05-15$94,900 Active 773-char remark
-
2024-08-05soldstatus $62,500
-
2016-09-26soldstatus $30,000
-
2007-04-27soldstatus $108,800
-
2006-12-11soldstatus $13,500 149-char remark
Show marketing remark (149 chars)
Great investment. Kitchen has been updated. Proof of funds or pre-qual must be submitted w/ all offers. Sellers addendum can be printed from the MLS.
-
2006-10-30$19,900 149-char remark
Show marketing remark (149 chars)
Great investment. Kitchen has been updated. Proof of funds or pre-qual must be submitted w/ all offers. Sellers addendum can be printed from the MLS.
-
2006-10-16historical
-
2006-06-27$27,500
-
2003-04-30historical
-
2003-01-31$59,900
-
2003-01-15historical
-
2002-05-10$59,900
-
1996-08-19soldstatus $18,000
-
1995-07-29$26,250
ⓘ Source: listings_history table (triggers on properties + properties_extension) + one-shot
backfill from property_details.listing_events for pre-trigger history.
Tax reassessment forecast OH · Partial reset (capped growth)
- Current annual tax
- $1,012 · $84/mo
- Projected year-2 tax
- $1,207 · $101/mo
- Expected delta
- +$195/yr (+$16/mo · 19.3%)
ⓘ Screening estimate from a state-policy table — verify with the county assessor before closing.
Climate risk First Street
- Flood 1/10 Low FEMA zone X (unshaded) · 0% chance over 30 yrs
- Wildfire 1/10 Low
- Heat 3/10 Moderate 7 d/yr ≥96°F today · 17 d/yr by 30 yrs out
- Wind 1/10 Low
- Air quality 2/10 Low 1 unhealthy d/yr today · 2 by 30 yrs out
Nearby sold comps map
Loading sold comps map…
Walkable amenities ~0.75 mi
Loading nearby amenities…
Taxation est. · year 1
- Rental income
- $13,122
- − Mortgage interest
- −$5,036
- − Property taxes
- −$1,012
- − Insurance
- −$450
- − Repairs & maintenance
- −$1,050
- − Management
- −$1,050
- − Depreciation
- −$2,615
- Taxable income
- $1,910
- Est. tax owed @ 24.0%
- −$458
- After-tax cash flow
- $2,789/yr
For passive investors: Depreciation is non-cash, so a rental often shows a tax loss while cash-flowing — sheltering income. Rental losses are passive: they offset passive income freely, and up to $25,000/yr can offset ordinary (W-2) income if you actively participate and your MAGI is under $100k (phasing out to $0 by $150k); unused losses carry forward. On sale, claimed depreciation is recaptured at up to 25%, and gains may owe capital-gains tax (a 1031 exchange can defer both). Figures are a year-1 estimate at your 24.0% rate — not tax advice; consult a CPA.
Schools (NCES district)
- District
- Canton City
- NCES district ID
- 3904371
- Math proficiency
- 17% ▼ -17.00%
- Reading proficiency
- 26% ▼ -12.00%
- Median HH income
- $28,825
- Composite
- 17.1/100
- National rank
- #9116
- State rank
- #627 of 656 in OH
Livability — Canton
- Score
- 71/100
- State rank
- #441
- US rank
- #7259
Category grades
Schools grade is shown separately in the Schools card above.
Census & demographics
- Census place
- Canton, OH
- County
- Stark County · 272,865 people
- City population
- 103,614
- Metro
- Canton-Massillon, OH
- Population (ZIP)
- 16,872
- Household income
- $43,439
- Rent vs Own
- Severe rent burden
- 524.0
Population outlook (Stark County) Hauer SSP2
- Today (2025)
- 373,708 people
- By 2030
- 371,245 · -0.7%
- By 2040
- 361,331 · -3.3%
- By 2050
- 345,290 · -7.6%
- By 2075
- 302,669 · -19.0%
- By 2100
- 238,870 · -36.1%
Race, ethnicity, and origin ACS 2023
- Neighborhood character
- Diverse neighborhood (Simpson 0.60)
- Race & ethnicity
- White 58% Black 22% Two or more races 13% Hispanic / Latino 9%
- Hispanic origin (detail)
- Mexican 2% Puerto Rican 2%
- Common ancestry
- Italian 5% Romanian 4% Lithuanian 2%
- Foreign-born
- 3% · Canada
- Languages at home
- 97% English-only · Spanish 2% German/W. Germanic 1%
Political lean MEDSL · Stark
- 2024 margin
- Strong R (+21.9) · D 38.6% · R 60.5%
- 2008→2024 swing
- -27.4pp toward R · 2008: 5.5pp · 2024: -21.9pp
- All cycles
- 2024: R+21.9 2020: R+18.5 2016: R+17.4 2012: R+0.4 2008: D+5.5
Not yet ingested
- Civics
- —
Market trends
- HPI YoY
- ▼ -200.62%
- Current HPI
- 150.1531
- Rent YoY
- ▼ -0.23%
- Metro
- Canton-Massillon, OH
- State GDP YoY
- ▲ 1.98%
- F500 in state
- 48
Industry mix (Fortune 500 HQ in OH)
| Industry | F500 HQs | Revenue |
|---|---|---|
| Insurance | 3 | $145B |
|
||
| Industrial Machinery | 3 | $49B |
|
||
| Financial Services | 3 | $24B |
|
||
| Consumer Goods | 2 | $93B |
|
||
| Aerospace / Defense | 2 | $47B |
|
||
| Utilities | 2 | $33B |
|
||
Price history
+242.5% since first listed15 events — show timeline
- 2026-06-15 Price Changed $89,900 MLSNOW
- 2026-05-15 Listed $94,900 MLSNOW
- 2024-08-05 Sold (Public Records) $62,500 Public Records
- 2016-09-26 Sold (Public Records) $30,000 Public Records
- 2007-04-27 Sold (Public Records) $108,800 Public Records
- 2006-12-11 Sold (MLS) $13,500 MLSNOW
- 2006-10-30 Listed $19,900 MLSNOW
- 2006-10-16 Listing Removed — MLSNOW
- 2006-06-27 Listed $27,500 MLSNOW
- 2003-04-30 Listing Removed — MLSNOW
- 2003-01-31 Listed $59,900 MLSNOW
- 2003-01-15 Listing Removed — MLSNOW
- 2002-05-10 Listed $59,900 MLSNOW
- 1996-08-19 Sold (Public Records) $18,000 Public Records
- 1995-07-29 Listed $26,250 MLSNOW
Property tax history
-8.5%/yrLatest (2024): $1,012 · +152.7% YoY. Source: county tax records.
Cash-flow waterfall
monthlySold comps — $/sqft
last 12 mo · ≤1 miLoading sold comps…