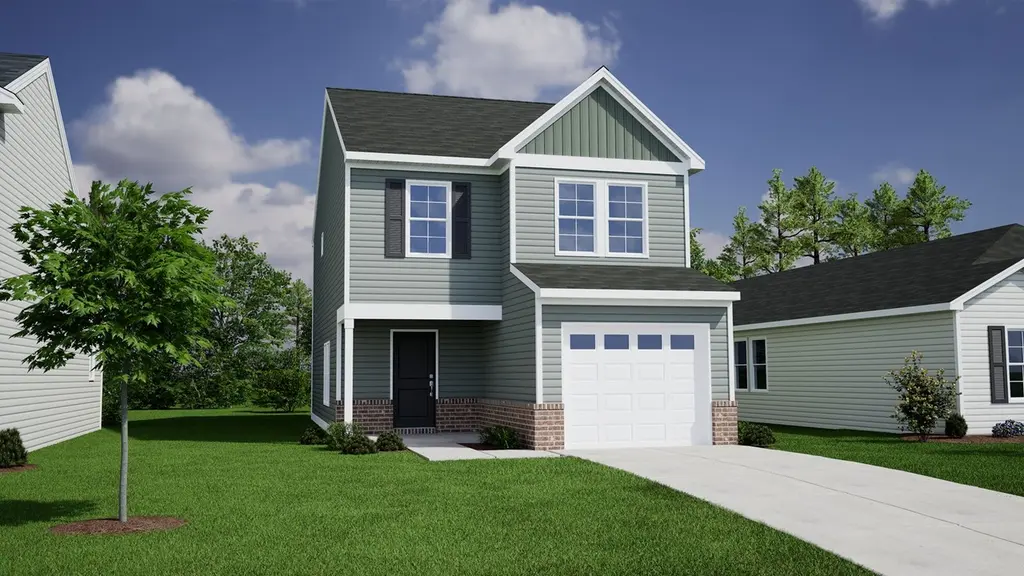
212 Laurinton Farms Dr
Hopkins, SC 29061
$238,000D
3 bd · 2.5 ba ·
1,476 sqft ·
Built 2026
· SingleFamily
· Active
· 57 DOM
Cashflow @ list (25.0% down · 7.5%)
Estimated rent
$2,116/mo
Mortgage (P&I)
−$1,248
Tax + insurance
−$397
HOA
−$44
Vac / Maint / Mgmt
−$444
Net cashflow
$-17/mo
Annual
$-202/yr
Cap rate
6.21%
Cash-on-cash
-0.30%
DSCR
0.99
1% rule
0.89%
Cash to close
$66,640
Investor read
- This is a 3-bed/2.5-bath single-family listed at $238k. Condition is rated excellent.
- At list price, monthly cash flow is $-17 ($-202/yr) — negative.
- To cash-flow at today's rent, offer at most $236k (1.0% below list).
- To meet the 1% rule (rent ≥ 1% of price), the offer needs to be $212k (11.1% below list).
- It's been on market 57 days — a 3% lower offer ($231k) is reasonable based on typical stale-listing flexibility.
- Recommended offer: $212k (11.1% below list) — sets the bar for 1% rule.
- Local home prices are declining (-3.0%/yr); year-one equity from $2k of loan paydown is wiped out by about $7k of value loss. Plan a longer hold.
- Location reads 59/100 on livability (#238 in SC) — a working-class tenant base; expect higher turnover. Strengths: cost of living A+, crime B+, housing B; Watch: employment D+, amenities F, commute F.
- Richland 01 (urban): math 26% / reading 36% proficiency, ranked #54 of 80 in SC (top 68%) — families likely to look elsewhere, expect single-tenant / working-renter base with shorter leases; 64% free/reduced lunch — lower-income household profile, screen leases tightly.
- Zoned schools: Horrell Hill Elementary (math 17% / reading 17%, grade F, #515 of 597 statewide, top 89%, 562 students, 100% FRL); Lower Richland High (math 5% / reading 64%, grade F, #185 of 196 statewide, top 94%, 1,244 students, 100% FRL) — zoned schools average 100% FRL vs 64% district-wide (36 pts higher); higher-poverty schools than district average — tighter screening recommended.
- Market conditions: 328 active listings in the ZIP; 3 comparable units currently listed for rent nearby; rentals at typical pace (median 14d on market — plan ~3-4 weeks tenant-placement turnaround); 3,472 units permitted in Richland County in 2024 (1,096 in 5+ unit buildings).
- Richland County population projected at +30% by 2050 — long-run rental-demand tailwind backs the buy-and-hold thesis.
- 2 sale attempts with the ask held roughly flat each time — persistent listings suggest the price (not the market) is what's stuck; bring a comps-based counter.
- This rent runs 42% of the median local income ($60k/yr) — at the standard rent-burdened threshold; future hikes will face affordability resistance.
Questions for listing agent
- What do current leases actually rent for vs. the listed asking? Can we see a recent rent roll and the last 12 months of T-12 income?
- It's been on market 57 days. Have you received any prior offers? Is the seller open to a 11% concession, seller financing, or rate buy-down credit?
- What does the HOA fee cover, when was the last increase, and are there any pending special assessments or reserve-fund shortfalls?
- Is there a deadline driving the sale (1031 exchange, divorce, estate, relocation)? That informs how much negotiation room exists.
- Schools are F-rated, which usually means shorter tenancies and higher turnover. Who's the typical renter profile here, and what's been the actual vacancy rate?
- The area grade is low — what's the realistic commute time and amenity access for the typical tenant pool here? Any planned neighborhood developments (good or bad) we should know about?
- What's the average days-on-market for RENTAL listings here right now (not sales)? A rising rental-DOM trend means longer vacancies and softer asking-rent achievability than the comps imply.
- What's the recent tenant-quality profile in this submarket — average credit score on applications, eviction rate, late-payment / NSF rate, and stable-employment percentage? A property-management company in the area should have these aggregated.
CashFlowRE · CFR-2HB8NF3JD3Z6SV
· Data 2 days ago
cashflowre.app · 2026-05-29