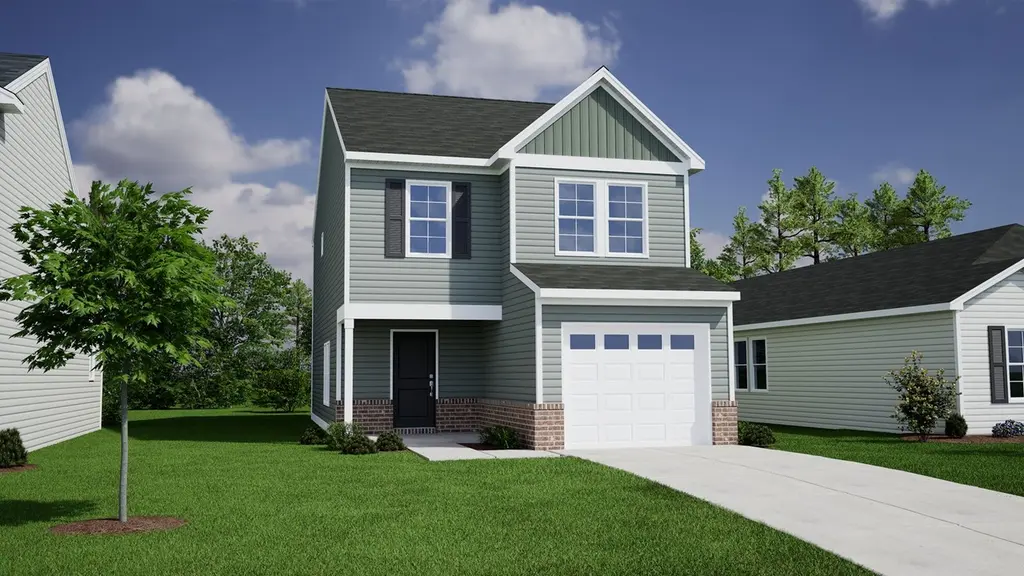
212 Laurinton Farms Dr · Hopkins, SC
Flood risk No data
- FEMA flood zone
- —
- Chance of flooding over 30 yrs
- —
- Est. flood insurance / yr
- —
Fire risk No data
- Est. fire insurance / yr
- —
Heat risk No data
- Hot days now (above threshold)
- —
- Hot days in 30 yrs
- —
Wind risk No data
- Chance of severe wind over 30 yrs
- —
Air-quality risk No data
- Unhealthy air days now
- —
- Unhealthy air days in 30 yrs
- —
Risk factors via First Street. Map © Google.
Why this score? — see what drove the D grade
The composite is a weighted blend of 9 inputs, each scored 0–100. Each bar is that input's sub-score; the figure is the points it added to the 100-point composite (weight × sub-score).
- Cash flow +12.9/30.0
- ARV discount +8.0/15.0
- Condition / age +4.8/5.0
- 1% rule +3.9/10.0
- DSCR +3.9/10.0
- Livability +3.0/5.0
- Schools +2.6/10.0
- Rent growth +2.5/5.0
- Appreciation +0.0/10.0
$238,000
🖨 Deal sheet 📄 Offer letter ✓ Due diligence
Listing remarks MLS
The Bartow plan offers the perfect blend of space and comfort. This thoughtfully designed two-story home features three bedrooms and two-and-one-half bathrooms. Step inside and you'll be greeted by luxury vinyl plank flooring that can be found throughout the entire first floor. The open layout includes a spacious kitchen with an adjacent dining area that flows into the great room, ideal for everyday living and entertaining. The kitchen comes equipped with Shaker style cabinets, Miami vena quartz countertops, and Stainless-Steel appliances. The primary suite comes with a a private bath which has a shower/tub combination, dual bowl vanity, and walk-in closet. Two additional bedrooms share a full bath nearby. The laundry room is conveniently located upstairs along with a storage and linen closet.
Key facts
- Quartz countertops
- Spacious bathroom
- Large walk-in closet
Tags
Property features AI
Finance
- HOA & community: Association present; Association maintains common areas, sidewalks, and street lights
Exterior
- Parking: Attached garage (main level); Two parking spaces total (one garage space)
- Utilities: Public water; Public sewer
- Home design: Two-story home
- Construction: Partial brick above foundation and vinyl exterior; Slab foundation
- Exterior features: Covered front porch; Uncovered back porch; Patio; Sprinkler system; Paved road access
Interior
- Kitchen: Eat-in kitchen with pantry and granite countertops; Microwave above stove; Free-standing range; Dishwasher; Garbage disposal
- Bedrooms: Master bedroom with double vanity, walk-in closet, and tub/shower (Second level); Second bedroom with private closet (Second level); Third bedroom with private closet (Second level)
- Flooring: Luxury vinyl plank in living and formal dining areas
- Bathrooms: Two full bathrooms; One half bathroom; One partial bathroom
- Heating & cooling: Central cooling; Central heating with gas on both first and second levels
- Interior features: Smoke detector; Pull-down attic access; Gas log (natural) fireplace (1)
- Laundry & utility: Washer/dryer located on the second level; Tankless and gas water heater
Neighborhood map
What this means for you Summary
Snapshot
- This is a 3-bed/2.5-bath single-family listed at $238k. Condition is rated excellent.
Deal economics
- At list price, monthly cash flow is $-17 ($-202/yr) — negative.
- To cash-flow at today's rent, offer at most $236k (1.0% below list).
- To meet the 1% rule (rent ≥ 1% of price), the offer needs to be $212k (11.1% below list).
- Recommended offer: $212k (11.1% below list) — sets the bar for 1% rule.
Location & tenants
- Location reads 59/100 on livability (#238 in SC) — a working-class tenant base; expect higher turnover. Strengths: cost of living A+, crime B+, housing B; Watch: employment D+, amenities F, commute F.
- Richland 01 (urban): math 26% / reading 36% proficiency, ranked #54 of 80 in SC (top 68%) — families likely to look elsewhere, expect single-tenant / working-renter base with shorter leases; 64% free/reduced lunch — lower-income household profile, screen leases tightly.
- Zoned schools: Horrell Hill Elementary (math 17% / reading 17%, grade F, #515 of 597 statewide, top 89%, 562 students, 100% FRL); Lower Richland High (math 5% / reading 64%, grade F, #185 of 196 statewide, top 94%, 1,244 students, 100% FRL) — zoned schools average 100% FRL vs 64% district-wide (36 pts higher); higher-poverty schools than district average — tighter screening recommended.
- Market conditions: 328 active listings in the ZIP; 3 comparable units currently listed for rent nearby; rentals at typical pace (median 14d on market — plan ~3-4 weeks tenant-placement turnaround); 3,472 units permitted in Richland County in 2024 (1,096 in 5+ unit buildings).
- This rent runs 42% of the median local income ($60k/yr) — at the standard rent-burdened threshold; future hikes will face affordability resistance.
Forward outlook
- Local home prices are declining (-3.0%/yr); year-one equity from $2k of loan paydown is wiped out by about $7k of value loss. Plan a longer hold.
- Richland County population projected at +30% by 2050 — long-run rental-demand tailwind backs the buy-and-hold thesis.
Negotiation context
- It's been on market 57 days — a 3% lower offer ($231k) is reasonable based on typical stale-listing flexibility.
- 2 sale attempts with the ask held roughly flat each time — persistent listings suggest the price (not the market) is what's stuck; bring a comps-based counter.
Questions for the listing agent
- What do current leases actually rent for vs. the listed asking? Can we see a recent rent roll and the last 12 months of T-12 income?
- It's been on market 57 days. Have you received any prior offers? Is the seller open to a 11% concession, seller financing, or rate buy-down credit?
- What does the HOA fee cover, when was the last increase, and are there any pending special assessments or reserve-fund shortfalls?
- Is there a deadline driving the sale (1031 exchange, divorce, estate, relocation)? That informs how much negotiation room exists.
- Schools are F-rated, which usually means shorter tenancies and higher turnover. Who's the typical renter profile here, and what's been the actual vacancy rate?
- The area grade is low — what's the realistic commute time and amenity access for the typical tenant pool here? Any planned neighborhood developments (good or bad) we should know about?
- What's the average days-on-market for RENTAL listings here right now (not sales)? A rising rental-DOM trend means longer vacancies and softer asking-rent achievability than the comps imply.
- What's the recent tenant-quality profile in this submarket — average credit score on applications, eviction rate, late-payment / NSF rate, and stable-employment percentage? A property-management company in the area should have these aggregated.
- How much new for-sale + rental construction is in the pipeline within 1–3 miles? Heavy new supply typically softens prices + rents 12–24 months out; constrained supply supports both.
Investment metrics
- 1% rule
- 0.89% ✗
- Cap rate
- 6.21%
- Cash-on-cash
- -0.30%
- DSCR
- 0.99
- GRM
- 9.4
CMA / ARV
- ARV (on-the-fly)
- $240,588
- Comps found
- 1
Show comp detail 1 sale within ~0.75 mi
| Address | Dist | Beds/Ba | Sqft | Sold | Price | $/sf | Match |
|---|---|---|---|---|---|---|---|
| 972 Harvest Valley Ln | 0.62mi | 3/2.5 | 1,404 (-5%) | 18mo | $228,900 | $163 | 48 |
Match score weights: distance 35% · size 25% · config 20% · recency 20%. Top-matched comps best support the ARV.
Projected returns pro-forma
-3.0% appreciation · 3.0% rent growth · sell at horizon
- IRR
- -16.8%
- Equity multiple
- 0.41×
- Total profit
- $-39,580
- Equity at exit
- $35,487
- IRR
- -8.6%
- Equity multiple
- 0.47×
- Total profit
- $-35,608
- Equity at exit
- $20,578
Cash invested: $66,640 (down + closing). Projections, not guarantees.
Landlord ↔ Tenant lean methodology
- Overall (STATE)
- 90 Strongly Landlord-Friendly
- State South Carolina
- 90 Strongly Landlord-Friendly · R+6
- County
- — inherits STATE
- City
- — inherits STATE
ZIP-level market 29061
- Home prices YoY
- -22.8%
- Active inventory
- 328
- Price-to-rent
- 9.4×
Monthly cashflow live
- Estimated rent
- $2,116 medium interval (Pro) →
- Mortgage (P&I)
- −$1,248
- Tax est. 1.5%
- −$298 /mo · $3,570/yr
- Insurance
- −$99
- HOA
- −$44
- Vacancy / Maint / Mgmt
- −$444
- Net cashflow
- $-17
Break-even live
UW: 25.0% down · 7.5% · 30yr · 1.5% tax · 5.0% vac · 8.0% maint · 8.0% mgmt
Financing live
Cash to close
- Down payment
- $59,500
- Closing costs
- $7,140
- Reserves months
- —
- Total cash needed
- —
Loan-product check · same deal, 3 products live
Conventional
25% down · 7.5% · 30yr
- Down + closing
- —
- Monthly P&I
- —
- Monthly cashflow
- —
- DSCR
- —
- Eligible?
- —
Personal DTI + credit; lowest rate.
DSCR
20% down · 8.5% · 30yr
- Down + closing
- —
- Monthly P&I
- —
- Monthly cashflow
- —
- DSCR
- —
- Eligible?
- —
No personal income docs; deal must DSCR.
Hard money
10% down · 12.0% · 12mo
- Down + closing
- —
- Monthly P&I
- —
- Monthly cashflow
- —
- DSCR
- —
- Eligible?
- —
Short-term bridge; refi at stabilization.
Rent comps 3 comps
| Address | Beds | Baths | Sqft | Rent | $/sqft | DOM | Units | Dist |
|---|---|---|---|---|---|---|---|---|
| 345 Bevington Brook Ln Hopkins, SC | 3.0 | 2.0 | 1475 | $2,195 | $1.49 | 23d | 1 | 1.06mi |
| 455 Hunters Crossing Dr Hopkins, SC | 3.0 | 2.0 | 1381 | $1,699 | $1.23 | 14d | 1 | 1.08mi |
| 1049 Crescent Moon Loop Hopkins, SC | 3.0 | 2.5 | 1650 | $2,100 | $1.27 | 14d | 1 | 1.14mi |
HOA detail
- Monthly dues
- $44 · $528/yr
Listing history 17 events
-
2026-06-18days on market $238,000 Active 57 DOM
-
2026-06-17days on market $238,000 Active 56 DOM
-
2026-06-16days on market $238,000 Active 55 DOM
-
2026-06-15days on market $238,000 Active 54 DOM
-
2026-06-14days on market $238,000 Active 52 DOM
-
2026-06-10days on market $238,000 Active 49 DOM
-
2026-06-09days on market $238,000 Active 48 DOM
-
2026-06-08days on market $238,000 Active 47 DOM
-
2026-06-07pricedays on market $238,000 Active 46 DOM
-
2026-06-03days on market $238,812 Active 42 DOM
-
2026-06-03days on market $238,812 Active 41 DOM
-
2026-06-02remarks 631-char remark
-
2026-06-01days on market $238,812 Active 40 DOM
-
2026-05-31days on market $238,812 Active 39 DOM
-
2026-05-21price $238,812
-
2026-05-20$238,812 Active 804-char remark
Show marketing remark (804 chars)
The Bartow plan offers the perfect blend of space and comfort. This thoughtfully designed two-story home features three bedrooms and two-and-one-half bathrooms. Step inside and you'll be greeted by luxury vinyl plank flooring that can be found throughout the entire first floor. The open layout includes a spacious kitchen with an adjacent dining area that flows into the great room, ideal for everyday living and entertaining. The kitchen comes equipped with Shaker style cabinets, Miami vena quartz countertops, and Stainless-Steel appliances. The primary suite comes with a a private bath which has a shower/tub combination, dual bowl vanity, and walk-in closet. Two additional bedrooms share a full bath nearby. The laundry room is conveniently located upstairs along with a storage and linen closet.
-
2026-04-22$238,806 Active
ⓘ Source: listings_history table (triggers on properties + properties_extension) + one-shot
backfill from property_details.listing_events for pre-trigger history.
Nearby sold comps map
Loading sold comps map…
Walkable amenities ~0.75 mi
Loading nearby amenities…
Taxation est. · year 1
- Rental income
- $25,396
- − Mortgage interest
- −$13,332
- − Property taxes
- −$3,570
- − Insurance
- −$1,190
- − Repairs & maintenance
- −$2,032
- − Management
- −$2,032
- − HOA
- −$528
- − Depreciation
- −$6,924
- Taxable loss
- −$4,211
- Est. tax savings @ 24.0%
- +$1,011
- After-tax cash flow
- $808/yr
For passive investors: Depreciation is non-cash, so a rental often shows a tax loss while cash-flowing — sheltering income. Rental losses are passive: they offset passive income freely, and up to $25,000/yr can offset ordinary (W-2) income if you actively participate and your MAGI is under $100k (phasing out to $0 by $150k); unused losses carry forward. On sale, claimed depreciation is recaptured at up to 25%, and gains may owe capital-gains tax (a 1031 exchange can defer both). Figures are a year-1 estimate at your 24.0% rate — not tax advice; consult a CPA.
Condition & rehab AI · 12 photos
This home is in excellent condition with a fresh interior and modern appliances. It's move-in ready and would benefit from minor updates to enhance its curb appeal and rental value.
Value-add opportunities
- Resale Paint interior walls — Fresh paint enhances curb appeal and interior aesthetics
- Rental Replace window treatments — Updated window treatments improve curb appeal and rental appeal
- Both Install smart home devices — Enhances home's modern appeal and convenience
Renovation cost estimate screening
Value-add ROI direction
- Resale Paint interior walls — Fresh paint enhances curb appeal and interior aesthetics ↑
- Rental Replace window treatments — Updated window treatments improve curb appeal and rental appeal ↑
- Both Install smart home devices — Enhances home's modern appeal and convenience ↑
ⓘ Cost ranges are severity-bucket heuristics (US national rule-of-thumb). Get contractor quotes + a written scope before underwriting a rehab budget.
Schools (NCES district)
- District
- Richland 01
- NCES district ID
- 4503360
- Math proficiency
- 26% ▼ -7.00%
- Reading proficiency
- 36% ▼ -5.00%
- Median HH income
- $38,931
- Composite
- 25.94/100
- National rank
- #7335
- State rank
- #54 of 80 in SC
Livability — Hopkins
- Score
- 59/100
- State rank
- #238
- US rank
- #19825
Category grades
Schools grade is shown separately in the Schools card above.
Census & demographics
- County
- Richland County · 389,530 people
- City population
- 12,538
- Metro
- Columbia, SC
- Population (ZIP)
- 12,538
- Household income
- $60,307
- Rent vs Own
- Severe rent burden
- 236.0
Population outlook (Richland County) Hauer SSP2
- Today (2025)
- 459,667 people
- By 2030
- 487,524 · +6.1%
- By 2040
- 542,035 · +17.9%
- By 2050
- 595,371 · +29.5%
- By 2075
- 732,998 · +59.5%
- By 2100
- 820,415 · +78.5%
Race, ethnicity, and origin ACS 2023
- Neighborhood character
- Predominantly Black (68%)
- Race & ethnicity
- Black 68% White 23% Two or more races 6% Hispanic / Latino 4%
- Common ancestry
- Italian 1% Lithuanian 1% Romanian 1%
- Foreign-born
- 3% · Canada
- Languages at home
- 96% English-only · Spanish 3%
Political lean MEDSL · Richland
- 2024 margin
- Solid D (+34.6) · D 66.4% · R 31.8% · Other 1.8%
- 2008→2024 swing
- +5.7pp toward D · 2008: 28.9pp · 2024: 34.6pp
- All cycles
- 2024: D+34.6 2020: D+38.3 2016: D+32.9 2012: D+33.3 2008: D+28.9
Not yet ingested
- Civics
- —
Market trends
- HPI YoY
- ▼ -57.44%
- Current HPI
- 194.8986
- Rent YoY
- —
- Metro
- Columbia, SC
- State GDP YoY
- ▲ 4.51%
- F500 in state
- 2
Industry mix (Fortune 500 HQ in SC)
| Industry | F500 HQs | Revenue |
|---|---|---|
| Packaging | 1 | $7B |
|
||
Price history
+0.0% since first listed3 events — show timeline
- 2026-05-21 Price Changed $238,812 Consolidated MLS
- 2026-05-20 Listed $238,812 Zillow
- 2026-04-22 Listed $238,806 Consolidated MLS
Cash-flow waterfall
monthlySold comps — $/sqft
last 12 mo · ≤1 miLoading sold comps…