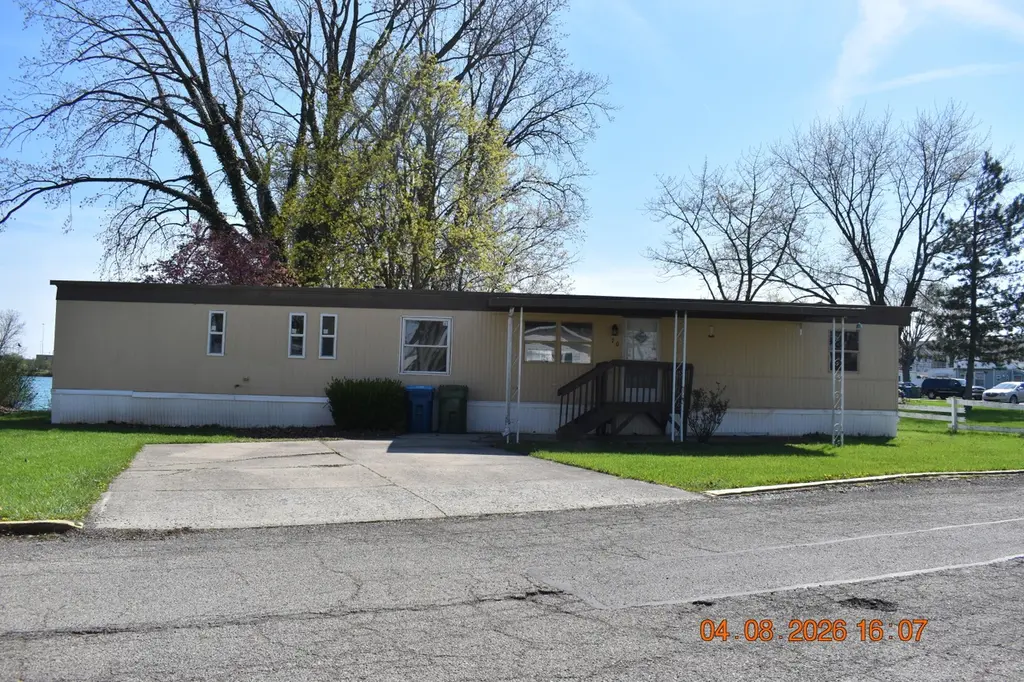
632 Folkerth Ave #70
Sidney, OH 45365
$32,000B+
2 bd · 1.0 ba ·
972 sqft ·
Built 1979
· Manufactured
· Active
· 102 DOM
Cashflow @ list (25.0% down · 7.5%)
Estimated rent
$787/mo
Mortgage (P&I)
−$168
Tax + insurance
−$53
HOA
−$0
Vac / Maint / Mgmt
−$165
Net cashflow
$401/mo
Annual
$4,808/yr
Cap rate
21.32%
Cash-on-cash
53.66%
DSCR
3.39
1% rule
2.46%
Cash to close
$8,960
Investor read
- This is a 2-bed/1.0-bath manufactured listed at $32k. Condition is rated good.
- At list price, monthly cash flow is $401 ($5k/yr) — positive.
- The deal already cash-flows at list — no discount required.
- Meets the 1% rule at list price ($787 rent vs $32k).
- It's been on market 102 days — a 9% lower offer ($29k) is reasonable based on typical stale-listing flexibility.
- Recommended offer: $29k (9.0% below list) — sets the bar for market timing.
- Local home prices are declining (-3.0%/yr); year-one equity from $221 of loan paydown is wiped out by about $960 of value loss. Plan a longer hold.
- Location reads 76/100 on livability (#220 in OH, #3,412 nationally) — a middle-class / working-renter tenant base. Strengths: cost of living A+, housing A+, health & safety A+; Watch: crime C-, employment C-, amenities D.
- Sidney City (town): math 46% / reading 52% proficiency, ranked #454 of 656 in OH (top 69%) — families likely to look elsewhere, expect single-tenant / working-renter base with shorter leases.
- Zoned schools: Longfellow Primary School (348 students, 72% FRL); Sidney Middle School (math 46% / reading 53%, grade C, #421 of 654 statewide, top 65%, 840 students, 60% FRL); Sidney High School (math 31% / reading 56%, grade F, #493 of 781 statewide, top 63%, 826 students, 55% FRL).
- Market conditions: 202 active listings in the ZIP; 10 comparable units currently listed for rent nearby; rentals lingering (median 64d on market — plan ~5-8 weeks vacancy on turnover, expect pricing pressure); 80% of comp listings sitting > 30 days — soft ceiling on asking rent; 337 units permitted in Shelby County in 2024 (216 in 5+ unit buildings).
- Shelby County population projected at -18% by 2050 — secular population decline; favor cash flow + early exit over multi-decade hold.
- 2 sale attempts; this cycle's ask has dropped $3k (9%) from the opening price — seller is motivated, your offer sets the floor, not the list.
- At projected returns (-3.0% appreciation + 3.0% rent growth), your $9k cash investment doubles in ~3 years — after that, you're playing with house money.
- Cap rate 21.3% vs local median 3.8% in Sidney — top-decile yield for the area; either an underpriced asset or a hidden risk that comps aren't pricing in. Stress-test before assuming the spread holds.
- This rent is only 14% of the median local income ($66k/yr) — well below the 30% rent-burden line; pricing power to push rent on renewal without tenant pushback.
Questions for listing agent
- It's been on market 102 days. Have you received any prior offers? Is the seller open to a 9% concession, seller financing, or rate buy-down credit?
- Built in 1979 — when were the roof, HVAC, electrical panel, plumbing, and water heater last replaced?
- Why hasn't it sold? Are there any deal-killer items the seller is aware of (foundation, flood, title, zoning, code violations)?
- Is there a deadline driving the sale (1031 exchange, divorce, estate, relocation)? That informs how much negotiation room exists.
- This sits on a lake — are riparian / water-frontage rights deeded with the parcel? Any dock permits, shoreline easements, or HOA water-use restrictions?
- What's the documented flood / surge / shoreline-erosion history here (FEMA AND non-FEMA — e.g., storm surge, creek backup, septic-field saturation)?
- Any water-quality or seasonal algae-bloom issues that affect tenant satisfaction or short-term-rental demand?
- What's the average days-on-market for RENTAL listings here right now (not sales)? A rising rental-DOM trend means longer vacancies and softer asking-rent achievability than the comps imply.
CashFlowRE · CFR-2HRG4H0M20MZ3P
· Data 2 weeks ago
cashflowre.app · 2026-05-29