 🏷️ Likely Rental
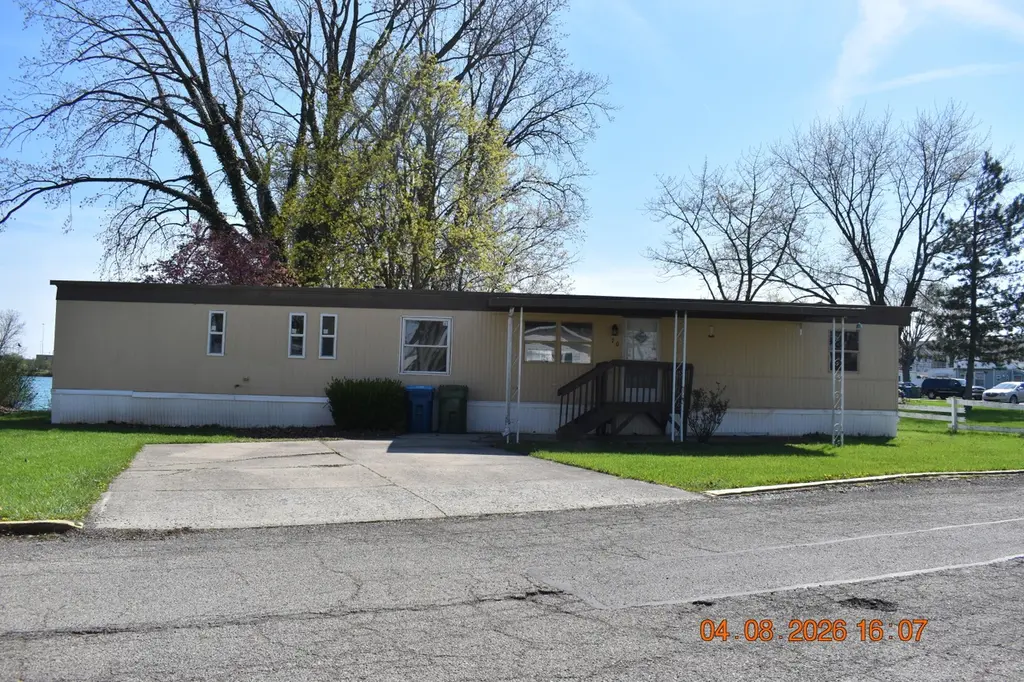
632 Folkerth Ave #70 · Sidney, OH
Flood risk 1/10 · Minimal
- FEMA flood zone
- X (unshaded)
- Chance of flooding over 30 yrs
- 0.0%
- Est. flood insurance / yr
- $507 – $1,088
Fire risk 1/10 · Minimal
- Est. fire insurance / yr
- $713 – $1,323
Heat risk 3/10 · Minor
- Hot days now (above 100°F)
- 7 days/yr
- Hot days in 30 yrs
- 17 days/yr
Wind risk 2/10 · Minimal
- Chance of severe wind over 30 yrs
- —
Air-quality risk 2/10 · Minimal
- Unhealthy air days now
- 1 days/yr
- Unhealthy air days in 30 yrs
- 2 days/yr
Risk factors via First Street. Map © Google.
Why this score? — see what drove the B+ grade
The composite is a weighted blend of 9 inputs, each scored 0–100. Each bar is that input's sub-score; the figure is the points it added to the 100-point composite (weight × sub-score).
- Cash flow +30.0/30.0
- ARV discount +15.0/15.0
- 1% rule +10.0/10.0
- DSCR +10.0/10.0
- Schools +4.2/10.0
- Condition / age +4.0/5.0
- Livability +3.8/5.0
- Rent growth +2.5/5.0
- Appreciation +0.0/10.0
$32,000
🖨 Deal sheet 📄 Offer letter ✓ Due diligence
Listing remarks MLS
Located at Lakeside Village Mobile Park less than 5 minutes from I-75, shopping plazas and eateries. This recently renovated 2 bed; 1 bath manufactured home is located on a private lake with your very own dock. All purchasers must complete an application and be approved for residency by park management. Lot rent is $470 per month, no utilities included.
Key facts
- Private dock
- Lakes side
- Built 1979
Tags
Neighborhood map
What this means for you Summary
Snapshot
- This is a 2-bed/1.0-bath manufactured listed at $32k. Condition is rated good.
Deal economics
- At list price, monthly cash flow is $575 ($7k/yr) — positive.
- The deal already cash-flows at list — no discount required.
- Meets the 1% rule at list price ($1k rent vs $32k).
- Recommended offer: $30k (6.0% below list) — sets the bar for market timing.
- Cap rate 27.8% vs local median 4.1% in Sidney — top-decile yield for the area; either an underpriced asset or a hidden risk that comps aren't pricing in. Stress-test before assuming the spread holds.
Location & tenants
- Location reads 76/100 on livability (#220 in OH, #3,412 nationally) — a middle-class / working-renter tenant base. Strengths: cost of living A+, housing A+, health & safety A+; Watch: crime C-, employment C-, amenities D.
- Sidney City (town): math 46% / reading 52% proficiency, ranked #454 of 656 in OH (top 69%) — families likely to look elsewhere, expect single-tenant / working-renter base with shorter leases.
- Market conditions: 145 active listings in the ZIP; 10 comparable units currently listed for rent nearby; rentals at typical pace (median 15d on market — plan ~3-4 weeks tenant-placement turnaround); 337 units permitted in Shelby County in 2024 (216 in 5+ unit buildings).
Forward outlook
- Local home prices are declining (-3.0%/yr); year-one equity from $221 of loan paydown is wiped out by about $960 of value loss. Plan a longer hold.
- Shelby County population projected at -18% by 2050 — secular population decline; favor cash flow + early exit over multi-decade hold.
- At projected returns (-3.0% appreciation + 3.0% rent growth), your $9k cash investment doubles in ~2 years — after that, you're playing with house money.
Negotiation context
- It's been on market 67 days — a 6% lower offer ($30k) is reasonable based on typical stale-listing flexibility.
- 2 sale attempts; this cycle's ask has dropped $3k (9%) from the opening price — seller is motivated, your offer sets the floor, not the list.
Questions for the listing agent
- It's been on market 67 days. Have you received any prior offers? Is the seller open to a 6% concession, seller financing, or rate buy-down credit?
- Built in 1979 — when were the roof, HVAC, electrical panel, plumbing, and water heater last replaced?
- Why hasn't it sold? Are there any deal-killer items the seller is aware of (foundation, flood, title, zoning, code violations)?
- Is there a deadline driving the sale (1031 exchange, divorce, estate, relocation)? That informs how much negotiation room exists.
- This sits on a lake — are riparian / water-frontage rights deeded with the parcel? Any dock permits, shoreline easements, or HOA water-use restrictions?
- What's the documented flood / surge / shoreline-erosion history here (FEMA AND non-FEMA — e.g., storm surge, creek backup, septic-field saturation)?
- Any water-quality or seasonal algae-bloom issues that affect tenant satisfaction or short-term-rental demand?
- What's the average days-on-market for RENTAL listings here right now (not sales)? A rising rental-DOM trend means longer vacancies and softer asking-rent achievability than the comps imply.
- What's the recent tenant-quality profile in this submarket — average credit score on applications, eviction rate, late-payment / NSF rate, and stable-employment percentage? A property-management company in the area should have these aggregated.
- How much new for-sale + rental construction is in the pipeline within 1–3 miles? Heavy new supply typically softens prices + rents 12–24 months out; constrained supply supports both.
Investment metrics
- 1% rule
- 3.15% ✓
- Cap rate
- 27.85%
- Cash-on-cash
- 76.98%
- DSCR
- 4.43
- GRM
- 2.6
CMA / ARV
- ARV (median comp)
- $42,950
- List price
- $32,000
- Delta
- -25.49%
- Verdict
- UNDERPRICED
- Comps
- 2 within 1.0 mi
Show comp detail 2 sales within ~0.75 mi
| Address | Dist | Beds/Ba | Sqft | Sold | Price | $/sf | Match |
|---|---|---|---|---|---|---|---|
| 632 Folkerth Ave #16 | 0.03mi | 2/2.0 | 924 (-5%) | 16mo | $42,000 | $45 | 73 |
| 1042 Apple Blossom Ln | 0.72mi | 2/2.0 | 883 (-9%) | 3mo | $46,000 | $52 | 44 |
Match score weights: distance 35% · size 25% · config 20% · recency 20%. Top-matched comps best support the ARV.
Projected returns pro-forma
-3.0% appreciation · 3.0% rent growth · sell at horizon
- IRR
- 77.0%
- Equity multiple
- 4.51×
- Total profit
- $31,436
- Equity at exit
- $4,771
- IRR
- 80.6%
- Equity multiple
- 9.32×
- Total profit
- $74,573
- Equity at exit
- $2,767
Cash invested: $8,960 (down + closing). Projections, not guarantees.
Landlord ↔ Tenant lean methodology
- Overall (STATE)
- 73 Landlord-Friendly
- State Ohio
- 73 Landlord-Friendly · R+6
- County
- — inherits STATE
- City
- — inherits STATE
ZIP-level market 45365
- Home prices YoY
- -20.1%
- Active inventory
- 145
- Price-to-rent
- 2.6×
Monthly cashflow live
- Estimated rent
- $1,007 high interval (Pro) →
- Mortgage (P&I)
- −$168
- Tax est. 1.5%
- −$40 /mo · $480/yr
- Insurance
- −$13
- HOA
- −$0
- Vacancy / Maint / Mgmt
- −$212
- Net cashflow
- $575
Break-even live
UW: 25.0% down · 7.5% · 30yr · 1.5% tax · 5.0% vac · 8.0% maint · 8.0% mgmt
Financing live
Cash to close
- Down payment
- $8,000
- Closing costs
- $960
- Reserves months
- —
- Total cash needed
- —
Loan-product check · same deal, 3 products live
Conventional
25% down · 7.5% · 30yr
- Down + closing
- —
- Monthly P&I
- —
- Monthly cashflow
- —
- DSCR
- —
- Eligible?
- —
Personal DTI + credit; lowest rate.
DSCR
20% down · 8.5% · 30yr
- Down + closing
- —
- Monthly P&I
- —
- Monthly cashflow
- —
- DSCR
- —
- Eligible?
- —
No personal income docs; deal must DSCR.
Hard money
10% down · 12.0% · 12mo
- Down + closing
- —
- Monthly P&I
- —
- Monthly cashflow
- —
- DSCR
- —
- Eligible?
- —
Short-term bridge; refi at stabilization.
Rent comps 10 comps
| Address | Beds | Baths | Sqft | Rent | $/sqft | DOM | Units | Dist |
|---|---|---|---|---|---|---|---|---|
| 612 N Wagner Ave Sidney, OH | 2.0 | 1.0 | 700 | $975 | $1.39 | 19d | 1 | 0.82mi |
| 600 N Wagner Ave Sidney, OH | 2.0 | 1.0 | 729 | $975 | $1.34 | 14d | 1 | 0.83mi |
| 560 N Wagner Ave Sidney, OH | 2.0 | 1.0 | 729 | $975 | $1.34 | 3d | 1 | 0.84mi |
| 776 Country Side Ln Sidney, OH | 3.0 | 1.0 | 1001 | $994 | $0.99 | 2d | 1 | 0.88mi |
| 934 Buckeye Ave Sidney, OH | 2.0 | 1.0 | 665 | $1,172 | $1.76 | 3d | 1 | 0.94mi |
| 934 Buckeye Ave Apt 212 Sidney, OH | 2.0 | 1.0 | 665 | $1,172 | $1.76 | 3d | 1 | 0.94mi |
| 751 Campbell Rd Sidney, OH | 2.0 | 1.0 | 980 | $1,100 | $1.12 | 3d | 1 | 1.27mi |
| 552 Stonecastle Ct Unit B1 Sidney, OH | 2.0 | 1.5 | 836 | $900 | $1.08 | 44d | 1 | 1.32mi |
| 552 Stonecastle Ct Sidney, OH | 2.0 | 1.0 | 836 | $900 | $1.08 | 44d | 1 | 1.32mi |
| 522 Stonecastle Ct Sidney, OH | 2.0 | 1.0 | 836 | $900 | $1.08 | 44d | 1 | 1.33mi |
Listing history 18 events
-
2026-06-18days on market $32,000 Active 67 DOM
-
2026-06-17days on market $32,000 Active 66 DOM
-
2026-06-16days on market $32,000 Active 65 DOM
-
2026-06-15days on market $32,000 Active 64 DOM
-
2026-06-14days on market $32,000 Active 62 DOM
-
2026-06-13days on market $32,000 Active 61 DOM
-
2026-06-10days on market $32,000 Active 59 DOM
-
2026-06-09days on market $32,000 Active 58 DOM
-
2026-06-08days on market $32,000 Active 57 DOM
-
2026-06-07days on market $32,000 Active 56 DOM
-
2026-06-03days on market $32,000 Active 52 DOM
-
2026-06-02days on market $32,000 Active 51 DOM
-
2026-06-01days on market $32,000 Active 50 DOM
-
2026-05-31days on market $32,000 Active 49 DOM
-
2026-05-31days on market $32,000 Active 48 DOM
-
2026-04-23status Active 355-char remark
Show marketing remark (355 chars)
Located at Lakeside Village Mobile Park less than 5 minutes from I-75, shopping plazas and eateries. This recently renovated 2 bed; 1 bath manufactured home is located on a private lake with your very own dock. All purchasers must complete an application and be approved for residency by park management. Lot rent is $470 per month, no utilities included.
-
2026-04-19status Pending 355-char remark
Show marketing remark (355 chars)
Located at Lakeside Village Mobile Park less than 5 minutes from I-75, shopping plazas and eateries. This recently renovated 2 bed; 1 bath manufactured home is located on a private lake with your very own dock. All purchasers must complete an application and be approved for residency by park management. Lot rent is $470 per month, no utilities included.
-
2026-04-08$35,000 Active 355-char remark
Show marketing remark (355 chars)
Located at Lakeside Village Mobile Park less than 5 minutes from I-75, shopping plazas and eateries. This recently renovated 2 bed; 1 bath manufactured home is located on a private lake with your very own dock. All purchasers must complete an application and be approved for residency by park management. Lot rent is $470 per month, no utilities included.
ⓘ Source: listings_history table (triggers on properties + properties_extension) + one-shot
backfill from property_details.listing_events for pre-trigger history.
Climate risk First Street
- Flood 1/10 Low FEMA zone X (unshaded) · 0% chance over 30 yrs
- Wildfire 1/10 Low
- Heat 3/10 Moderate 7 d/yr ≥100°F today · 17 d/yr by 30 yrs out
- Wind 2/10 Low
- Air quality 2/10 Low 1 unhealthy d/yr today · 2 by 30 yrs out
Nearby sold comps map
Loading sold comps map…
Walkable amenities ~0.75 mi
Loading nearby amenities…
Taxation est. · year 1
- Rental income
- $12,090
- − Mortgage interest
- −$1,792
- − Property taxes
- −$480
- − Insurance
- −$160
- − Repairs & maintenance
- −$967
- − Management
- −$967
- − Depreciation
- −$931
- Taxable income
- $6,792
- Est. tax owed @ 24.0%
- −$1,630
- After-tax cash flow
- $5,267/yr
For passive investors: Depreciation is non-cash, so a rental often shows a tax loss while cash-flowing — sheltering income. Rental losses are passive: they offset passive income freely, and up to $25,000/yr can offset ordinary (W-2) income if you actively participate and your MAGI is under $100k (phasing out to $0 by $150k); unused losses carry forward. On sale, claimed depreciation is recaptured at up to 25%, and gains may owe capital-gains tax (a 1031 exchange can defer both). Figures are a year-1 estimate at your 24.0% rate — not tax advice; consult a CPA.
Condition & rehab AI · 12 photos
This recently renovated 2-bedroom, 1-bathroom manufactured home is located on a private lake with a dock. The home is in good condition with recent updates to the kitchen and bathrooms, and it offers a peaceful lakeside setting.
Value-add opportunities
- Both Paint exterior siding — Enhances curb appeal and value
- Both Replace outdoor lighting — Improves safety and enhances curb appeal
- Both Install new outdoor furniture — Enhances outdoor living space and appeal
Renovation cost estimate screening
Value-add ROI direction
- Both Paint exterior siding — Enhances curb appeal and value ↑
- Both Replace outdoor lighting — Improves safety and enhances curb appeal ↑
- Both Install new outdoor furniture — Enhances outdoor living space and appeal ↑
ⓘ Cost ranges are severity-bucket heuristics (US national rule-of-thumb). Get contractor quotes + a written scope before underwriting a rehab budget.
Schools (NCES district)
- District
- Sidney City
- NCES district ID
- 3910003
- Math proficiency
- 46% ▼ -14.00%
- Reading proficiency
- 52% ▼ -6.00%
- Median HH income
- $45,974
- Composite
- 41.55/100
- National rank
- #3443
- State rank
- #454 of 656 in OH
Livability — Sidney
- Score
- 76/100
- State rank
- #220
- US rank
- #3412
Category grades
Schools grade is shown separately in the Schools card above.
Census & demographics
- Census place
- Sidney, OH
- County
- Shelby · 44,840 people
- City population
- 28,955
- Population (ZIP)
- 28,955
- Household income
- $66,044
- Rent vs Own
- Severe rent burden
- 5.7
Population outlook (Shelby County) Hauer SSP2
- Today (2025)
- 47,264 people
- By 2030
- 45,935 · -2.8%
- By 2040
- 42,786 · -9.5%
- By 2050
- 38,981 · -17.5%
- By 2075
- 30,225 · -36.1%
- By 2100
- 21,273 · -55.0%
Race, ethnicity, and origin ACS 2023
- Neighborhood character
- Predominantly White (90%)
- Race & ethnicity
- White 90% Two or more races 4% Black 3% Hispanic / Latino 2%
- Common ancestry
- Lithuanian 3% Slovak 1% Italian 1%
- Foreign-born
- 2% · Canada
- Languages at home
- 98% English-only · Spanish 1%
Political lean MEDSL · Shelby
- 2024 margin
- Solid R (+64.8) · D 17.2% · R 82.0%
- 2008→2024 swing
- -28.5pp toward R · 2008: -36.4pp · 2024: -64.8pp
- All cycles
- 2024: R+64.8 2020: R+63.2 2016: R+60.6 2012: R+46.0 2008: R+36.4
Not yet ingested
- Civics
- —
Market trends
- HPI YoY
- ▼ -66.62%
- Current HPI
- 264.4532
- Rent YoY
- —
- Metro
- —
- State GDP YoY
- ▲ 1.98%
- F500 in state
- 48
Industry mix (Fortune 500 HQ in OH)
| Industry | F500 HQs | Revenue |
|---|---|---|
| Insurance | 3 | $145B |
|
||
| Industrial Machinery | 3 | $49B |
|
||
| Financial Services | 3 | $24B |
|
||
| Consumer Goods | 2 | $93B |
|
||
| Aerospace / Defense | 2 | $47B |
|
||
| Utilities | 2 | $33B |
|
||
Price history
3 events — show timeline
- 2026-04-23 Relisted — WRIST
- 2026-04-19 Pending — WRIST
- 2026-04-08 Listed $35,000 WRIST
Cash-flow waterfall
monthlySold comps — $/sqft
last 12 mo · ≤1 miLoading sold comps…