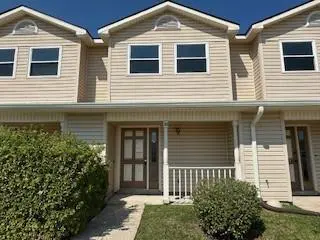
1600 Marseille Dr #20
Laplace, LA 70068
$74,900B+
2 bd · 1.5 ba ·
1,225 sqft ·
Built 2004
· SingleFamily
· Active
· 101 DOM
Cashflow @ list (25.0% down · 7.5%)
Estimated rent
$1,518/mo
Mortgage (P&I)
−$393
Tax + insurance
−$127
HOA
−$320
Vac / Maint / Mgmt
−$319
Net cashflow
$359/mo
Annual
$4,309/yr
Cap rate
12.05%
Cash-on-cash
20.55%
DSCR
1.91
1% rule
2.03%
Cash to close
$20,972
Investor read
- This is a 2-bed/1.5-bath single-family listed at $75k.
- At list price, monthly cash flow is $359 ($4k/yr) — positive.
- The deal already cash-flows at list — no discount required.
- Meets the 1% rule at list price ($2k rent vs $75k).
- It's been on market 101 days — a 9% lower offer ($68k) is reasonable based on typical stale-listing flexibility.
- Recommended offer: $68k (9.0% below list) — sets the bar for market timing.
- Local home prices are declining (-3.0%/yr); year-one equity from $518 of loan paydown is wiped out by about $2k of value loss. Plan a longer hold.
- Location reads 70/100 on livability (#61 in LA) — a middle-class / working-renter tenant base. Strengths: cost of living A+, housing A+, health & safety A+; Watch: crime F, amenities F, commute F.
- St. John The Baptist Parish (suburban): math 13% / reading 25% proficiency, ranked #68 of 98 in LA (top 69%) — low school quality limits family demand, transient renter base, plan for 1-2y turnover; 82% free/reduced lunch — lower-income household profile, screen leases tightly.
- Zoned schools: John L. Ory Communications Magnet Elementary (math 33% / reading 48%, grade F, #218 of 646 statewide, top 34%, 371 students, 29% FRL); East St. John Preparatory Academy (math 6% / reading 16%, grade F, #195 of 218 statewide, top 90%, 392 students, 63% FRL); East St. John High School (math 19% / reading 25%, grade F, #171 of 265 statewide, top 66%, 1,459 students, 48% FRL) — zoned schools average 47% FRL vs 82% district-wide (36 pts lower); this property's tenant base skews higher-income than the district average.
- Watch-outs: HOA is 21% of rent.
- Market conditions: 179 active listings in the ZIP; 61 units permitted in St. John the Baptist Parish in 2024 (0 in 5+ unit buildings).
- St. John the Baptist County population projected at -20% by 2050 — secular population decline; favor cash flow + early exit over multi-decade hold.
- 8 sale attempts since 28y ago; this cycle's ask has dropped $12k (14%) from the opening price — seller is motivated, your offer sets the floor, not the list.
- At projected returns (-3.0% appreciation + 3.0% rent growth), your $21k cash investment doubles in ~6 years — after that, you're playing with house money.
- Climate carrying-cost: severe wind risk, 99% chance of damaging wind over 30y; extreme-heat days projected 7→23/yr by 2055 (HVAC capex compounding) — expect insurance premiums to compound above CPI over the hold.
- Cap rate 12.0% vs local median 4.8% in Laplace — top-decile yield for the area; either an underpriced asset or a hidden risk that comps aren't pricing in. Stress-test before assuming the spread holds.
Questions for listing agent
- It's been on market 101 days. Have you received any prior offers? Is the seller open to a 9% concession, seller financing, or rate buy-down credit?
- What does the HOA fee cover, when was the last increase, and are there any pending special assessments or reserve-fund shortfalls?
- Why hasn't it sold? Are there any deal-killer items the seller is aware of (foundation, flood, title, zoning, code violations)?
- Is there a deadline driving the sale (1031 exchange, divorce, estate, relocation)? That informs how much negotiation room exists.
- Crime grade is F in this area — have there been break-ins, vandalism, or insurance claims at this property in the last 3 years? What carrier currently insures it and at what premium?
- What's the average days-on-market for RENTAL listings here right now (not sales)? A rising rental-DOM trend means longer vacancies and softer asking-rent achievability than the comps imply.
- What's the recent tenant-quality profile in this submarket — average credit score on applications, eviction rate, late-payment / NSF rate, and stable-employment percentage? A property-management company in the area should have these aggregated.
- How much new for-sale + rental construction is in the pipeline within 1–3 miles? Heavy new supply typically softens prices + rents 12–24 months out; constrained supply supports both.
CashFlowRE · CFR-2J382Q64J82KW3
· Data 23 h ago
cashflowre.app · 2026-05-29