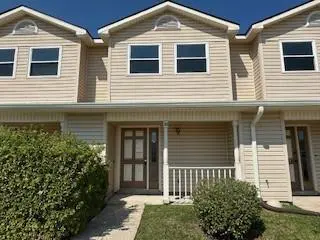
1600 Marseille Dr #20 · Laplace, LA
Flood risk 3/10 · Minor
- FEMA flood zone
- X (shaded)
- Chance of flooding over 30 yrs
- 0.12%
- Est. flood insurance / yr
- $507 – $1,088
Fire risk 1/10 · Minimal
- Est. fire insurance / yr
- $1,269 – $2,357
Heat risk 9/10 · Severe
- Hot days now (above 108°F)
- 7 days/yr
- Hot days in 30 yrs
- 23 days/yr
Wind risk 9/10 · Severe
- Chance of severe wind over 30 yrs
- 99.0%
Air-quality risk 3/10 · Minor
- Unhealthy air days now
- 2 days/yr
- Unhealthy air days in 30 yrs
- 3 days/yr
Risk factors via First Street. Map © Google.
Why this score? — see what drove the B+ grade
The composite is a weighted blend of 9 inputs, each scored 0–100. Each bar is that input's sub-score; the figure is the points it added to the 100-point composite (weight × sub-score).
- Cash flow +30.0/30.0
- ARV discount +15.0/15.0
- 1% rule +10.0/10.0
- DSCR +10.0/10.0
- Livability +3.5/5.0
- Rent growth +2.5/5.0
- Condition / age +2.5/5.0
- Schools +1.7/10.0
- Appreciation +0.0/10.0
$74,900
🖨 Deal sheet (PDF) 📄 Offer letter ✓ Due diligence
Listing remarks MLS
Welcome to this inviting 2-bedroom, 1.5-bathroom condo that blends comfort with opportunity. Some updates have already been completed, and the space is ready for you to add your own finishing touches. Featuring a functional floor plan, private bedrooms, and convenient bathrooms, this home offers great potential as a personal residence or investment property. With a head start on renovations, you can create the perfect space to match your style.
Key facts
- $320 HOA
- Built 2004
- Listed 101 days
Neighborhood map
What this means for you Summary
Snapshot
- This is a 2-bed/1.5-bath single-family listed at $75k.
Deal economics
- At list price, monthly cash flow is $359 ($4k/yr) — positive.
- The deal already cash-flows at list — no discount required.
- Meets the 1% rule at list price ($2k rent vs $75k).
- Recommended offer: $68k (9.0% below list) — sets the bar for market timing.
- Cap rate 12.0% vs local median 4.8% in Laplace — top-decile yield for the area; either an underpriced asset or a hidden risk that comps aren't pricing in. Stress-test before assuming the spread holds.
Location & tenants
- Location reads 70/100 on livability (#61 in LA) — a middle-class / working-renter tenant base. Strengths: cost of living A+, housing A+, health & safety A+; Watch: crime F, amenities F, commute F.
- St. John The Baptist Parish (suburban): math 13% / reading 25% proficiency, ranked #68 of 98 in LA (top 69%) — low school quality limits family demand, transient renter base, plan for 1-2y turnover; 82% free/reduced lunch — lower-income household profile, screen leases tightly.
- Zoned schools: John L. Ory Communications Magnet Elementary (math 33% / reading 48%, grade F, #218 of 646 statewide, top 34%, 371 students, 29% FRL); East St. John Preparatory Academy (math 6% / reading 16%, grade F, #195 of 218 statewide, top 90%, 392 students, 63% FRL); East St. John High School (math 19% / reading 25%, grade F, #171 of 265 statewide, top 66%, 1,459 students, 48% FRL) — zoned schools average 47% FRL vs 82% district-wide (36 pts lower); this property's tenant base skews higher-income than the district average.
- Market conditions: 179 active listings in the ZIP; 61 units permitted in St. John the Baptist Parish in 2024 (0 in 5+ unit buildings).
Forward outlook
- Local home prices are declining (-3.0%/yr); year-one equity from $518 of loan paydown is wiped out by about $2k of value loss. Plan a longer hold.
- St. John the Baptist County population projected at -20% by 2050 — secular population decline; favor cash flow + early exit over multi-decade hold.
- At projected returns (-3.0% appreciation + 3.0% rent growth), your $21k cash investment doubles in ~6 years — after that, you're playing with house money.
Negotiation context
- It's been on market 101 days — a 9% lower offer ($68k) is reasonable based on typical stale-listing flexibility.
- 8 sale attempts since 28y ago; this cycle's ask has dropped $12k (14%) from the opening price — seller is motivated, your offer sets the floor, not the list.
Risks & watch-outs
- Watch-outs: HOA is 21% of rent.
- Climate carrying-cost: severe wind risk, 99% chance of damaging wind over 30y; extreme-heat days projected 7→23/yr by 2055 (HVAC capex compounding) — expect insurance premiums to compound above CPI over the hold.
Questions for the listing agent
- It's been on market 101 days. Have you received any prior offers? Is the seller open to a 9% concession, seller financing, or rate buy-down credit?
- What does the HOA fee cover, when was the last increase, and are there any pending special assessments or reserve-fund shortfalls?
- Why hasn't it sold? Are there any deal-killer items the seller is aware of (foundation, flood, title, zoning, code violations)?
- Is there a deadline driving the sale (1031 exchange, divorce, estate, relocation)? That informs how much negotiation room exists.
- Crime grade is F in this area — have there been break-ins, vandalism, or insurance claims at this property in the last 3 years? What carrier currently insures it and at what premium?
- What's the average days-on-market for RENTAL listings here right now (not sales)? A rising rental-DOM trend means longer vacancies and softer asking-rent achievability than the comps imply.
- What's the recent tenant-quality profile in this submarket — average credit score on applications, eviction rate, late-payment / NSF rate, and stable-employment percentage? A property-management company in the area should have these aggregated.
- How much new for-sale + rental construction is in the pipeline within 1–3 miles? Heavy new supply typically softens prices + rents 12–24 months out; constrained supply supports both.
Investment metrics
- 1% rule
- 2.03% ✓
- Cap rate
- 12.05%
- Cash-on-cash
- 20.55%
- DSCR
- 1.91
- GRM
- 4.1
CMA / ARV
- ARV (median comp)
- $127,042
- List price
- $74,900
- Delta
- -41.04%
- Verdict
- UNDERPRICED
- Comps
- 14 within 1.0 mi
Show comp detail 12 sales within ~0.75 mi
| Address | Dist | Beds/Ba | Sqft | Sold | Price | $/sf | Match |
|---|---|---|---|---|---|---|---|
| 365 Cottage Ct | 0.14mi | 3/2.0 (+1) | 1,200 (-2%) | 6mo | $141,000 | $118 | 78 |
| 388 Hester Dr | 0.33mi | 3/2.0 (+1) | 1,225 (0%) | 3mo | $186,000 | $152 | 75 |
| 308 Arlington Dr | 0.34mi | 2/1.0 | 1,200 (-2%) | 5mo | $158,500 | $132 | 74 |
| 388 Fairway Dr | 0.27mi | 3/2.0 (+1) | 1,286 (+5%) | 2mo | $175,000 | $136 | 71 |
| 396 Fairway Dr | 0.26mi | 3/2.0 (+1) | 1,270 (+4%) | 7mo | $97,125 | $76 | 69 |
| 308 Linwood Dr | 0.19mi | 3/2.0 (+1) | 1,107 (-10%) | 1mo | $175,000 | $158 | 67 |
| 1613 Bayonne Dr | 0.30mi | 3/2.0 (+1) | 1,314 (+7%) | 2mo | $220,000 | $167 | 65 |
| 320 Elmwood Dr | 0.39mi | 3/2.0 (+1) | 1,307 (+7%) | 3mo | $194,000 | $148 | 61 |
| 504 Oak Allee Dr | 0.68mi | 3/2.0 (+1) | 1,235 (+1%) | 1mo | $175,000 | $142 | 59 |
| 387 Highland Dr | 0.42mi | 3/2.0 (+1) | 1,146 (-6%) | 6mo | $180,000 | $157 | 58 |
| 508 Parlange Loop | 0.61mi | 3/1.0 (+1) | 1,100 (-10%) | 4mo | $151,000 | $137 | 44 |
| 2036 Lafitte St | 0.73mi | 3/2.0 (+1) | 1,358 (+11%) | 0mo | $185,000 | $136 | 41 |
Match score weights: distance 35% · size 25% · config 20% · recency 20%. Top-matched comps best support the ARV.
Projected returns pro-forma
-3.0% appreciation · 3.0% rent growth · sell at horizon
- IRR
- 13.1%
- Equity multiple
- 1.52×
- Total profit
- $10,953
- Equity at exit
- $11,168
- IRR
- 22.1%
- Equity multiple
- 2.90×
- Total profit
- $39,883
- Equity at exit
- $6,476
Cash invested: $20,972 (down + closing). Projections, not guarantees.
Landlord ↔ Tenant lean methodology
- Overall (STATE)
- 90 Strongly Landlord-Friendly
- State Louisiana
- 90 Strongly Landlord-Friendly · R+12
- County
- — inherits STATE
- City
- — inherits STATE
ZIP-level market 70068
- Home prices YoY
- -20.1%
- Active inventory
- 179
- Price-to-rent
- 4.1×
Monthly cashflow live
- Estimated rent
- $1,518 medium interval (Pro) →
- Mortgage (P&I)
- −$393
- Tax from tax record
- −$96 /mo · $1,149/yr
- Insurance
- −$31
- HOA
- −$320
- Vacancy / Maint / Mgmt
- −$319
- Net cashflow
- $359
Break-even live
Sensitivity live
| Price | -10% $401 | -5% $380 | +0% $359 | +5% $338 | +10% $317 |
|---|---|---|---|---|---|
| Rent | -10% $239 | -5% $299 | +0% $359 | +5% $419 | +10% $479 |
| Rate | -1.0pp $397 | -0.5pp $378 | base $359 | +0.5pp $340 | +1.0pp $320 |
UW: 25.0% down · 7.5% · 30yr · 1.5% tax · 5.0% vac · 8.0% maint · 8.0% mgmt
Financing live
Cash to close
- Down payment
- $18,725
- Closing costs
- $2,247
- Reserves months
- —
- Total cash needed
- —
Loan-product check · same deal, 3 products live
Conventional
25% down · 7.5% · 30yr
- Down + closing
- —
- Monthly P&I
- —
- Monthly cashflow
- —
- DSCR
- —
- Eligible?
- —
Personal DTI + credit; lowest rate.
DSCR
20% down · 8.5% · 30yr
- Down + closing
- —
- Monthly P&I
- —
- Monthly cashflow
- —
- DSCR
- —
- Eligible?
- —
No personal income docs; deal must DSCR.
Hard money
10% down · 12.0% · 12mo
- Down + closing
- —
- Monthly P&I
- —
- Monthly cashflow
- —
- DSCR
- —
- Eligible?
- —
Short-term bridge; refi at stabilization.
HOA detail
- Monthly dues
- $320 · $3,840/yr
Listing history 33 events
-
2026-06-21days on market $74,900 Active 101 DOM
-
2026-06-19days on market $74,900 Active 99 DOM
-
2026-06-18days on market $74,900 Active 98 DOM
-
2026-06-17days on market $74,900 Active 97 DOM
-
2026-06-16pricedays on market $74,900 Active 96 DOM
-
2026-06-15days on market $79,900 Active 95 DOM
-
2026-06-14days on market $79,900 Active 93 DOM
-
2026-06-13days on market $79,900 Active 92 DOM
-
2026-06-10days on market $79,900 Active 90 DOM
-
2026-06-09days on market $79,900 Active 89 DOM
-
2026-06-08days on market $79,900 Active 88 DOM
-
2026-06-07days on market $79,900 Active 87 DOM
-
2026-06-02days on market $79,900 Active 82 DOM
-
2026-06-01days on market $79,900 Active 81 DOM
-
2026-05-31days on market $79,900 Active 80 DOM
-
2026-05-30days on market $79,900 Active 79 DOM
-
2026-04-07price $79,900 448-char remark
Show marketing remark (448 chars)
Welcome to this inviting 2-bedroom, 1.5-bathroom condo that blends comfort with opportunity. Some updates have already been completed, and the space is ready for you to add your own finishing touches. Featuring a functional floor plan, private bedrooms, and convenient bathrooms, this home offers great potential as a personal residence or investment property. With a head start on renovations, you can create the perfect space to match your style.
-
2026-03-12$86,900 Active 448-char remark
Show marketing remark (448 chars)
Welcome to this inviting 2-bedroom, 1.5-bathroom condo that blends comfort with opportunity. Some updates have already been completed, and the space is ready for you to add your own finishing touches. Featuring a functional floor plan, private bedrooms, and convenient bathrooms, this home offers great potential as a personal residence or investment property. With a head start on renovations, you can create the perfect space to match your style.
-
2025-11-24price $93,900
-
2025-11-19price $93,900
-
2025-09-29price $99,900
-
2025-09-29price $99,900
-
2025-09-28$114,900 Active
-
2024-06-28$119,000 Active
-
2009-03-24soldstatus
-
2009-03-05soldstatus $108,000
-
2009-01-11$115,000
-
2009-01-11$115,000
-
1998-02-17soldstatus $55,000
-
1998-01-05$55,000
-
1998-01-05$55,000
ⓘ Source: listings_history table (triggers on properties + properties_extension) + one-shot
backfill from property_details.listing_events for pre-trigger history.
Tax reassessment forecast LA · Resets to sale price
- Current annual tax
- $1,149 · $96/mo
- Projected year-2 tax
- $1,149 · $96/mo
- Expected delta
- $0/yr ($0/mo · 0.0%)
ⓘ Screening estimate from a state-policy table — verify with the county assessor before closing.
Climate risk First Street
- Flood 3/10 Moderate FEMA zone X (shaded) · 12% chance over 30 yrs
- Wildfire 1/10 Low
- Heat 9/10 Extreme 7 d/yr ≥108°F today · 23 d/yr by 30 yrs out
- Wind 9/10 Extreme 99% chance of damaging wind over 30 yrs
- Air quality 3/10 Moderate 2 unhealthy d/yr today · 3 by 30 yrs out
Nearby sold comps map
Loading sold comps map…
Walkable amenities ~0.75 mi
Loading nearby amenities…
Taxation est. · year 1
- Rental income
- $18,210
- − Mortgage interest
- −$4,196
- − Property taxes
- −$1,149
- − Insurance
- −$374
- − Repairs & maintenance
- −$1,457
- − Management
- −$1,457
- − HOA
- −$3,840
- − Depreciation
- −$2,179
- Taxable income
- $3,558
- Est. tax owed @ 24.0%
- −$854
- After-tax cash flow
- $3,455/yr
For passive investors: Depreciation is non-cash, so a rental often shows a tax loss while cash-flowing — sheltering income. Rental losses are passive: they offset passive income freely, and up to $25,000/yr can offset ordinary (W-2) income if you actively participate and your MAGI is under $100k (phasing out to $0 by $150k); unused losses carry forward. On sale, claimed depreciation is recaptured at up to 25%, and gains may owe capital-gains tax (a 1031 exchange can defer both). Figures are a year-1 estimate at your 24.0% rate — not tax advice; consult a CPA.
Schools (NCES district)
- District
- St. John The Baptist Parish
- NCES district ID
- 2201530
- Math proficiency
- 13% ▼ -42.00%
- Reading proficiency
- 25% ▼ -39.00%
- Median HH income
- $50,280
- Composite
- 17.07/100
- National rank
- #9120
- State rank
- #68 of 98 in LA
Livability — Laplace
- Score
- 70/100
- State rank
- #61
- US rank
- #7898
Category grades
Schools grade is shown separately in the Schools card above.
Census & demographics
- Census place
- Laplace, LA
- County
- Saint John the Baptist Parish · 32,720 people
- Metro
- New Orleans-Metairie, LA
- Population (ZIP)
- 32,720
- Household income
- $68,459
- Rent vs Own
- Severe rent burden
- 750.0
Population outlook (St. John the Baptist County) Hauer SSP2
- Today (2025)
- 40,972 people
- By 2030
- 39,295 · -4.1%
- By 2040
- 35,902 · -12.4%
- By 2050
- 32,988 · -19.5%
- By 2075
- 28,661 · -30.0%
- By 2100
- 26,456 · -35.4%
Race, ethnicity, and origin ACS 2023
- Neighborhood character
- Diverse neighborhood (Simpson 0.62)
- Race & ethnicity
- Black 51% White 34% Hispanic / Latino 9% Two or more races 5% Asian 1%
- Hispanic origin (detail)
- Puerto Rican 1%
- Common ancestry
- Lithuanian 11%
- Foreign-born
- 5% · Canada
- Languages at home
- 91% English-only · Spanish 6% Tagalog/Filipino 1%
Political lean MEDSL · St. John the Baptist
- 2024 margin
- Strong D (+29.1) · D 64.0% · R 34.8% · Other 1.2%
- 2008→2024 swing
- +12.9pp toward D · 2008: 16.2pp · 2024: 29.1pp
- All cycles
- 2024: D+29.1 2020: D+28.2 2016: D+24.5 2012: D+26.3 2008: D+16.2
Not yet ingested
- Civics
- —
Market trends
- HPI YoY
- ▼ -60.04%
- Current HPI
- 239.1429
- Rent YoY
- —
- Metro
- New Orleans-Metairie, LA
- State GDP YoY
- ▲ 3.29%
- F500 in state
- 10
Industry mix (Fortune 500 HQ in LA)
| Industry | F500 HQs | Revenue |
|---|---|---|
| Telecommunications | 2 | $23B |
|
||
| Utilities | 1 | $12B |
|
||
| Wholesale / Distribution | 1 | $5B |
|
||
| Advertising | 1 | $2B |
|
||
Price history
+45.3% since first listed17 events — show timeline
- 2026-04-07 Price Changed $79,900 AcadianaMLS
- 2026-04-07 Price Changed $79,900 GSREIN
- 2026-03-12 Listed $86,900 GSREIN
- 2026-03-12 Listed $86,900 AcadianaMLS
- 2025-11-24 Price Changed $93,900 AcadianaMLS
- 2025-11-19 Price Changed $93,900 GSREIN
- 2025-09-29 Price Changed $99,900 AcadianaMLS
- 2025-09-29 Price Changed $99,900 GSREIN
- 2025-09-28 Listed $114,900 AcadianaMLS
- 2024-06-28 Listed $119,000 AcadianaMLS
- 2009-03-24 Sold (Public Records) — Public Records
- 2009-03-05 Sold (MLS) $108,000 GSREIN
- 2009-01-11 Listed $115,000 AcadianaMLS
- 2009-01-11 Listed $115,000 GSREIN
- 1998-02-17 Sold (MLS) $55,000 GSREIN
- 1998-01-05 Listed $55,000 AcadianaMLS
- 1998-01-05 Listed $55,000 GSREIN
Property tax history
+1.1%/yrLatest (2025): $1,149 · +441.6% YoY. Source: county tax records.
Cash-flow waterfall
monthlySold comps — $/sqft
last 12 mo · ≤1 miLoading sold comps…