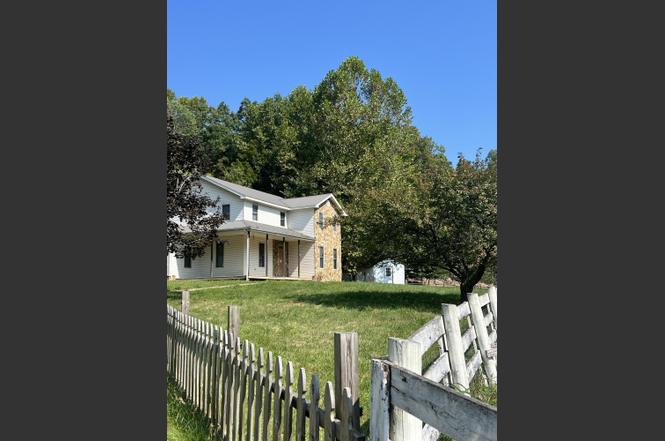
875 Upper Craney Rd
Morehead, KY 40351
$129,900B-
4 bd · 3.5 ba ·
3,530 sqft ·
Built 2003
· SingleFamily
· Active
· 3 DOM
Cashflow @ list (25.0% down · 7.5%)
Estimated rent
$1,808/mo
Mortgage (P&I)
−$681
Tax + insurance
−$348
HOA
−$0
Vac / Maint / Mgmt
−$380
Net cashflow
$400/mo
Annual
$4,796/yr
Cap rate
11.14%
Cash-on-cash
17.32%
DSCR
1.77
1% rule
1.39%
Cash to close
$36,372
Investor read
- This is a 4-bed/3.5-bath single-family listed at $130k.
- At list price, monthly cash flow is $400 ($5k/yr) — positive.
- The deal already cash-flows at list — no discount required.
- Meets the 1% rule at list price ($2k rent vs $130k).
- Only 3 days on market — expect competitive offers; lowballing is unlikely to land.
- Local home prices are declining (-3.0%/yr); year-one equity from $898 of loan paydown is wiped out by about $4k of value loss. Plan a longer hold.
- Location reads 62/100 on livability (#345 in KY) — a middle-class / working-renter tenant base. Strengths: cost of living A+, crime A; Watch: health & safety C-, housing D, amenities F.
- Rowan County (rural): math 28% / reading 41% proficiency, ranked #74 of 165 in KY (top 45%) — families likely to look elsewhere, expect single-tenant / working-renter base with shorter leases.
- Zoned schools: Rodburn Elementary School (math 17% / reading 37%, grade F, #434 of 676 statewide, top 69%, 403 students, 77% FRL); Rowan County Middle School (math 31% / reading 46%, grade F, #68 of 217 statewide, top 32%, 716 students, 62% FRL); Rowan County Senior High School (math 29% / reading 31%, grade F, #122 of 254 statewide, top 49%, 1,017 students, 60% FRL).
- Watch-outs: flood insurance adds $125/mo.
- Market conditions: 147 active listings in the ZIP; 15 units permitted in Rowan County in 2024 (0 in 5+ unit buildings).
- Rowan County population projected at +35% by 2050 — long-run rental-demand tailwind backs the buy-and-hold thesis.
- 11 sale attempts since 18y ago with the ask held roughly flat each time — persistent listings suggest the price (not the market) is what's stuck; bring a comps-based counter.
- At projected returns (-3.0% appreciation + 3.0% rent growth), your $36k cash investment doubles in ~9 years — after that, you're playing with house money.
- Climate carrying-cost: in FEMA flood zone A (mandatory federal flood insurance); major wildfire risk — expect insurance premiums to compound above CPI over the hold.
- Cap rate 11.1% vs local median 4.7% in Morehead — top-decile yield for the area; either an underpriced asset or a hidden risk that comps aren't pricing in. Stress-test before assuming the spread holds.
- This rent runs 42% of the median local income ($52k/yr) — at the standard rent-burdened threshold; future hikes will face affordability resistance.
Questions for listing agent
- What's the actual annual flood-insurance premium (NFIP or private), and is the property in a SFHA with mandatory coverage?
- Is there a deadline driving the sale (1031 exchange, divorce, estate, relocation)? That informs how much negotiation room exists.
- Schools are D-rated, which usually means shorter tenancies and higher turnover. Who's the typical renter profile here, and what's been the actual vacancy rate?
- What's the average days-on-market for RENTAL listings here right now (not sales)? A rising rental-DOM trend means longer vacancies and softer asking-rent achievability than the comps imply.
- What's the recent tenant-quality profile in this submarket — average credit score on applications, eviction rate, late-payment / NSF rate, and stable-employment percentage? A property-management company in the area should have these aggregated.
- How much new for-sale + rental construction is in the pipeline within 1–3 miles? Heavy new supply typically softens prices + rents 12–24 months out; constrained supply supports both.
CashFlowRE · CFR-2JRX283BEAV0RE
· Data 2 days ago
cashflowre.app · 2026-05-29