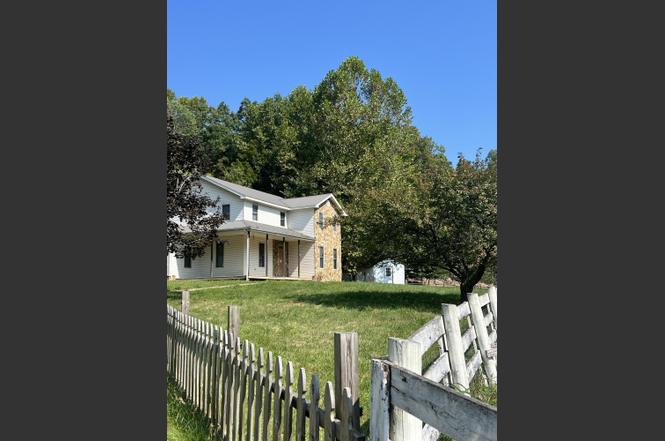
875 Upper Craney Rd · Morehead, KY
Flood risk 10/10 · Severe
- FEMA flood zone
- A
- Chance of flooding over 30 yrs
- 0.99%
- Est. flood insurance / yr
- $1,009 – $1,996
Fire risk 6/10 · Moderate
- Est. fire insurance / yr
- $839 – $1,559
Heat risk 3/10 · Minor
- Hot days now (above 101°F)
- 7 days/yr
- Hot days in 30 yrs
- 20 days/yr
Wind risk 2/10 · Minimal
- Chance of severe wind over 30 yrs
- 2.0%
Air-quality risk 1/10 · Minimal
- Unhealthy air days now
- 0 days/yr
- Unhealthy air days in 30 yrs
- 0 days/yr
Risk factors via First Street. Map © Google.
Why this score? — see what drove the B- grade
The composite is a weighted blend of 9 inputs, each scored 0–100. Each bar is that input's sub-score; the figure is the points it added to the 100-point composite (weight × sub-score).
- Cash flow +30.0/30.0
- DSCR +10.0/10.0
- 1% rule +8.9/10.0
- ARV discount +7.5/15.0
- Livability +3.1/5.0
- Schools +2.8/10.0
- Rent growth +2.5/5.0
- Condition / age +2.5/5.0
- Appreciation +0.0/10.0
$129,900
🖨 Deal sheet 📄 Offer letter ✓ Due diligence
Listing remarks
Opportunity awaits just outside Morehead, KY! Situated on 4.5 beautiful acres, this spacious 4-bedroom home offers the perfect blend of privacy, space, and potential. Featuring a large kitchen ideal for gathering and entertaining, this property is ready for someone with vision to bring it back to life. Whether you're looking for your next investment, fixer-upper project, or a chance to create your dream country home, this property has the bones and acreage to make it happen. Enjoy peaceful surroundings, room to roam, and endless possibilities—all just minutes from town. Bring your ideas and unlock this property's full potential!
Key facts
- Large kitchen
- 4.5 acres
- 4.51 acre lot
Tags
Property features AI
Exterior
- Parking: Attached garage; Driveway
- Utilities: Public and well water; No sewer
- Home design: House; Two levels
- Construction: Other foundation; Other construction materials
- Exterior features: Shed(s); Secluded lot; Wooded lot; Views of trees/woods, mountains and farmland
Interior
- Kitchen: No appliances included
- Bedrooms: 2 total rooms
- Bathrooms: 3 full bathrooms; 1 half bathroom
- Interior features: Entrance foyer; Eat-in kitchen; Primary bedroom on the first floor
Neighborhood map
What this means for you Summary
Snapshot
- This is a 4-bed/3.5-bath single-family listed at $130k.
Deal economics
- At list price, monthly cash flow is $400 ($5k/yr) — positive.
- The deal already cash-flows at list — no discount required.
- Meets the 1% rule at list price ($2k rent vs $130k).
- Cap rate 11.1% vs local median 4.7% in Morehead — top-decile yield for the area; either an underpriced asset or a hidden risk that comps aren't pricing in. Stress-test before assuming the spread holds.
Location & tenants
- Location reads 62/100 on livability (#345 in KY) — a middle-class / working-renter tenant base. Strengths: cost of living A+, crime A; Watch: health & safety C-, housing D, amenities F.
- Rowan County (rural): math 28% / reading 41% proficiency, ranked #74 of 165 in KY (top 45%) — families likely to look elsewhere, expect single-tenant / working-renter base with shorter leases.
- Zoned schools: Rodburn Elementary School (math 17% / reading 37%, grade F, #434 of 676 statewide, top 69%, 403 students, 77% FRL); Rowan County Middle School (math 31% / reading 46%, grade F, #68 of 217 statewide, top 32%, 716 students, 62% FRL); Rowan County Senior High School (math 29% / reading 31%, grade F, #122 of 254 statewide, top 49%, 1,017 students, 60% FRL).
- Market conditions: 147 active listings in the ZIP; 15 units permitted in Rowan County in 2024 (0 in 5+ unit buildings).
- This rent runs 42% of the median local income ($52k/yr) — at the standard rent-burdened threshold; future hikes will face affordability resistance.
Forward outlook
- Local home prices are declining (-3.0%/yr); year-one equity from $898 of loan paydown is wiped out by about $4k of value loss. Plan a longer hold.
- Rowan County population projected at +35% by 2050 — long-run rental-demand tailwind backs the buy-and-hold thesis.
- At projected returns (-3.0% appreciation + 3.0% rent growth), your $36k cash investment doubles in ~9 years — after that, you're playing with house money.
Negotiation context
- Only 3 days on market — expect competitive offers; lowballing is unlikely to land.
- 11 sale attempts since 18y ago with the ask held roughly flat each time — persistent listings suggest the price (not the market) is what's stuck; bring a comps-based counter.
Risks & watch-outs
- Watch-outs: flood insurance adds $125/mo.
- Climate carrying-cost: in FEMA flood zone A (mandatory federal flood insurance); major wildfire risk — expect insurance premiums to compound above CPI over the hold.
Questions for the listing agent
- What's the actual annual flood-insurance premium (NFIP or private), and is the property in a SFHA with mandatory coverage?
- Is there a deadline driving the sale (1031 exchange, divorce, estate, relocation)? That informs how much negotiation room exists.
- Schools are D-rated, which usually means shorter tenancies and higher turnover. Who's the typical renter profile here, and what's been the actual vacancy rate?
- What's the average days-on-market for RENTAL listings here right now (not sales)? A rising rental-DOM trend means longer vacancies and softer asking-rent achievability than the comps imply.
- What's the recent tenant-quality profile in this submarket — average credit score on applications, eviction rate, late-payment / NSF rate, and stable-employment percentage? A property-management company in the area should have these aggregated.
- How much new for-sale + rental construction is in the pipeline within 1–3 miles? Heavy new supply typically softens prices + rents 12–24 months out; constrained supply supports both.
Investment metrics
- 1% rule
- 1.39% ✓
- Cap rate
- 11.14%
- Cash-on-cash
- 17.32%
- DSCR
- 1.77
- GRM
- 6.0
CMA / ARV
No comps found within radius.
Projected returns pro-forma
-3.0% appreciation · 3.0% rent growth · sell at horizon
- IRR
- 3.2%
- Equity multiple
- 1.12×
- Total profit
- $4,512
- Equity at exit
- $19,369
- IRR
- 12.8%
- Equity multiple
- 2.02×
- Total profit
- $37,143
- Equity at exit
- $11,231
Cash invested: $36,372 (down + closing). Projections, not guarantees.
Landlord ↔ Tenant lean methodology
- Overall (STATE)
- 83 Strongly Landlord-Friendly
- State Kentucky
- 83 Strongly Landlord-Friendly · R+16
- County
- — inherits STATE
- City
- — inherits STATE
ZIP-level market 40351
- Home prices YoY
- -22.6%
- Active inventory
- 147
- Price-to-rent
- 6.0×
Monthly cashflow live
- Estimated rent
- $1,808 medium interval (Pro) →
- Mortgage (P&I)
- −$681
- Tax from tax record
- −$168 /mo · $2,020/yr
- Insurance
- −$54
- Flood insurance flood zone
- −$125 /mo · $1,502/yr
- HOA
- −$0
- Vacancy / Maint / Mgmt
- −$380
- Net cashflow
- $400
Break-even live
UW: 25.0% down · 7.5% · 30yr · 1.5% tax · 5.0% vac · 8.0% maint · 8.0% mgmt
Financing live
Cash to close
- Down payment
- $32,475
- Closing costs
- $3,897
- Reserves months
- —
- Total cash needed
- —
Loan-product check · same deal, 3 products live
Conventional
25% down · 7.5% · 30yr
- Down + closing
- —
- Monthly P&I
- —
- Monthly cashflow
- —
- DSCR
- —
- Eligible?
- —
Personal DTI + credit; lowest rate.
DSCR
20% down · 8.5% · 30yr
- Down + closing
- —
- Monthly P&I
- —
- Monthly cashflow
- —
- DSCR
- —
- Eligible?
- —
No personal income docs; deal must DSCR.
Hard money
10% down · 12.0% · 12mo
- Down + closing
- —
- Monthly P&I
- —
- Monthly cashflow
- —
- DSCR
- —
- Eligible?
- —
Short-term bridge; refi at stabilization.
Listing history 4 events
-
2026-06-18days on market $129,900 Active 3 DOM
-
2026-06-17days on market $129,900 Active 2 DOM
-
2026-06-15remarks 636-char remark
-
2026-06-15$129,900 Active 1 DOM
ⓘ Source: listings_history table (triggers on properties + properties_extension) + one-shot
backfill from property_details.listing_events for pre-trigger history.
Tax reassessment forecast KY · Resets to sale price
- Current annual tax
- $2,020 · $168/mo
- Projected year-2 tax
- $2,020 · $168/mo
- Expected delta
- $0/yr ($0/mo · 0.0%)
ⓘ Screening estimate from a state-policy table — verify with the county assessor before closing.
Climate risk First Street
- Flood 10/10 Extreme FEMA zone A · 99% chance over 30 yrs
- Wildfire 6/10 Major
- Heat 3/10 Moderate 7 d/yr ≥101°F today · 20 d/yr by 30 yrs out
- Wind 2/10 Low 2% chance of damaging wind over 30 yrs
- Air quality 1/10 Low 0 unhealthy d/yr today · 0 by 30 yrs out
Nearby sold comps map
Loading sold comps map…
Walkable amenities ~0.75 mi
Loading nearby amenities…
Taxation est. · year 1
- Rental income
- $21,699
- − Mortgage interest
- −$7,276
- − Property taxes
- −$2,020
- − Insurance
- −$2,152
- − Repairs & maintenance
- −$1,736
- − Management
- −$1,736
- − Depreciation
- −$3,779
- Taxable income
- $3,000
- Est. tax owed @ 24.0%
- −$720
- After-tax cash flow
- $4,076/yr
For passive investors: Depreciation is non-cash, so a rental often shows a tax loss while cash-flowing — sheltering income. Rental losses are passive: they offset passive income freely, and up to $25,000/yr can offset ordinary (W-2) income if you actively participate and your MAGI is under $100k (phasing out to $0 by $150k); unused losses carry forward. On sale, claimed depreciation is recaptured at up to 25%, and gains may owe capital-gains tax (a 1031 exchange can defer both). Figures are a year-1 estimate at your 24.0% rate — not tax advice; consult a CPA.
Schools (NCES district)
- District
- Rowan County
- NCES district ID
- 2105100
- Math proficiency
- 28% ▼ -19.00%
- Reading proficiency
- 41% ▼ -12.00%
- Median HH income
- $35,139
- Composite
- 28.47/100
- National rank
- #6742
- State rank
- #74 of 165 in KY
Livability — Morehead
- Score
- 62/100
- State rank
- #345
- US rank
- #16479
Category grades
Schools grade is shown separately in the Schools card above.
Census & demographics
- County
- Rowan County · 22,322 people
- City population
- 22,322
- Metro
- nan
- Population (ZIP)
- 22,322
- Household income
- $51,835
- Rent vs Own
- Severe rent burden
- 589.0
Population outlook (Rowan County) Hauer SSP2
- Today (2025)
- 27,518 people
- By 2030
- 29,242 · +6.3%
- By 2040
- 32,949 · +19.7%
- By 2050
- 37,128 · +34.9%
- By 2075
- 49,130 · +78.5%
- By 2100
- 59,014 · +114.5%
Race, ethnicity, and origin ACS 2023
- Neighborhood character
- Predominantly White (94%)
- Race & ethnicity
- White 94% Hispanic / Latino 2% Two or more races 2% Black 1%
- Common ancestry
- Slovak 2% Serbian 1% Lithuanian 1%
- Foreign-born
- 2% · Canada
- Languages at home
- 98% English-only · Spanish 2%
Political lean MEDSL · Rowan
- 2024 margin
- Strong R (+27.8) · D 35.3% · R 63.0% · Other 1.7%
- 2008→2024 swing
- -29.8pp toward R · 2008: 2.0pp · 2024: -27.8pp
- All cycles
- 2024: R+27.8 2020: R+21.0 2016: R+21.3 2012: R+7.8 2008: D+2.0
Not yet ingested
- Civics
- —
Market trends
- HPI YoY
- ▼ -59.28%
- Current HPI
- 203.0786
- Rent YoY
- —
- Metro
- nan
- State GDP YoY
- ▲ 1.81%
- F500 in state
- 4
Industry mix (Fortune 500 HQ in KY)
| Industry | F500 HQs | Revenue |
|---|---|---|
| Healthcare | 1 | $118B |
|
||
| Food / Beverage | 1 | $7B |
|
||
Price history
+136.2% since first listed31 events — show timeline
- 2026-06-15 Listed $129,900 ImagineMLS
- 2025-04-14 Listing Removed — ImagineMLS
- 2025-03-10 Price Changed $164,900 ImagineMLS
- 2025-02-07 Price Changed $169,900 ImagineMLS
- 2024-12-16 Price Changed $199,900 ImagineMLS
- 2024-11-15 Price Changed $207,500 ImagineMLS
- 2024-10-15 Listed $210,000 ImagineMLS
- 2022-12-12 Price Changed $221,000 ImagineMLS
- 2022-12-08 Relisted — ImagineMLS
- 2022-10-19 Pending — ImagineMLS
- 2022-10-19 Listing Removed — ImagineMLS
- 2022-10-10 Listed $235,000 ImagineMLS
- 2020-07-09 Listing Removed — ImagineMLS
- 2020-01-09 Listed $249,500 ImagineMLS
- 2017-11-20 Sold (Public Records) $222,500 Public Records
- 2017-11-20 Sold (MLS) $222,500 ImagineMLS
- 2017-09-18 Pending — ImagineMLS
- 2017-09-18 Pending — ImagineMLS
- 2017-09-15 Listing Removed — ImagineMLS
- 2017-08-16 Listed $250,000 ImagineMLS
- 2017-08-15 Listed $250,000 ImagineMLS
- 2017-08-15 Listing Removed — ImagineMLS
- 2017-08-15 Listing Removed — ImagineMLS
- 2017-04-19 Listed $355,000 ImagineMLS
- 2017-04-19 Listed $355,000 ImagineMLS
- 2011-09-15 Listing Removed — ImagineMLS
- 2011-07-20 Sold (Public Records) $230,000 Public Records
- 2011-03-15 Listed $224,900 ImagineMLS
- 2008-01-08 Sold (MLS) $180,000 ImagineMLS
- 2008-01-01 Listed $199,900 ImagineMLS
- 2002-07-01 Sold (Public Records) $55,000 Public Records
Cash-flow waterfall
monthlySold comps — $/sqft
last 12 mo · ≤1 miLoading sold comps…