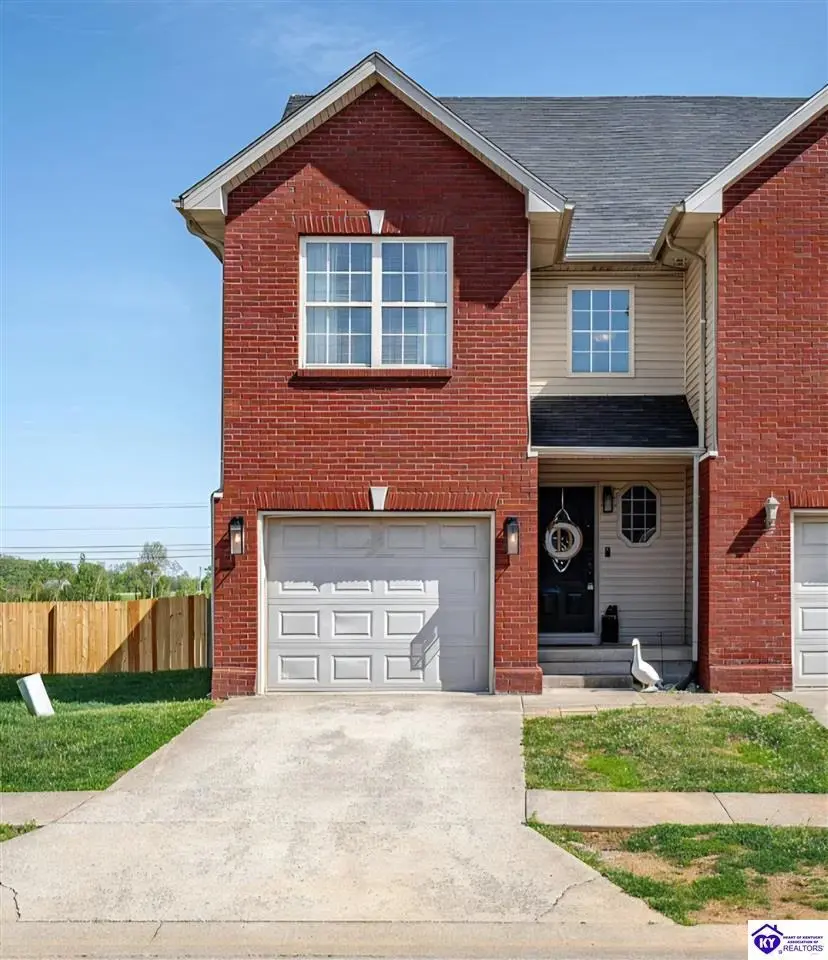
153 Twin Lakes Dr
Vine Grove, KY 40175
$224,900D-
3 bd · 2.5 ba ·
1,382 sqft ·
Built 2006
· Condo
· Pending
· 7 DOM
Cashflow @ list (25.0% down · 7.5%)
Estimated rent
$1,737/mo
Mortgage (P&I)
−$1,179
Tax + insurance
−$188
HOA
−$0
Vac / Maint / Mgmt
−$365
Net cashflow
$5/mo
Annual
$63/yr
Cap rate
6.32%
Cash-on-cash
0.10%
DSCR
1.00
1% rule
0.77%
Cash to close
$62,972
Investor read
- This is a 3-bed/2.5-bath condo listed at $225k.
- At list price, monthly cash flow is $5 ($63/yr) — positive.
- The deal already cash-flows at list — no discount required.
- To meet the 1% rule (rent ≥ 1% of price), the offer needs to be $174k (22.8% below list).
- Only 7 days on market — expect competitive offers; lowballing is unlikely to land.
- Recommended offer: $174k (22.8% below list) — sets the bar for 1% rule.
- Local home prices are declining (-3.0%/yr); year-one equity from $2k of loan paydown is wiped out by about $7k of value loss. Plan a longer hold.
- Location reads 72/100 on livability (#124 in KY) — a middle-class / working-renter tenant base. Strengths: crime A+, cost of living A+, housing A+; Watch: amenities F, commute F, health & safety F.
- Hardin County (suburban): math 30% / reading 43% proficiency, ranked #47 of 165 in KY (top 28%) — families likely to look elsewhere, expect single-tenant / working-renter base with shorter leases.
- Market conditions: 155 active listings in the ZIP; 2 comparable units currently listed for rent nearby; 946 units permitted in Hardin County in 2024 (464 in 5+ unit buildings).
- Hardin County population projected at -16% by 2050 — secular population decline; favor cash flow + early exit over multi-decade hold.
- 8 sale attempts since 19y ago with the ask held roughly flat each time — persistent listings suggest the price (not the market) is what's stuck; bring a comps-based counter.
- Current owner paid $117k; list at $225k implies a 92% gain — meaningful room to come down on a strong offer.
- Climate carrying-cost: extreme-heat days projected 7→19/yr by 2055 (HVAC capex compounding) — expect insurance premiums to compound above CPI over the hold.
- Cap rate 6.3% vs local median 4.0% in Vine Grove — top-decile yield for the area; either an underpriced asset or a hidden risk that comps aren't pricing in. Stress-test before assuming the spread holds.
Questions for listing agent
- Any open or pending special assessments — roof, HVAC, plumbing, elevator, façade? What's the per-unit balance and payoff schedule, and is the seller paying it off at close or rolling it to the buyer?
- Is there a deadline driving the sale (1031 exchange, divorce, estate, relocation)? That informs how much negotiation room exists.
- The area grade is low — what's the realistic commute time and amenity access for the typical tenant pool here? Any planned neighborhood developments (good or bad) we should know about?
- What's the average days-on-market for RENTAL listings here right now (not sales)? A rising rental-DOM trend means longer vacancies and softer asking-rent achievability than the comps imply.
- What's the recent tenant-quality profile in this submarket — average credit score on applications, eviction rate, late-payment / NSF rate, and stable-employment percentage? A property-management company in the area should have these aggregated.
- How much new apartment / multifamily construction is in the pipeline within 1–3 miles? Heavy new supply (>2% of stock underway) typically softens rents 12–24 months out; light construction supports rent growth.
CashFlowRE · CFR-2JXK0D8BH7AVM3
· Data 3 weeks ago
cashflowre.app · 2026-05-29