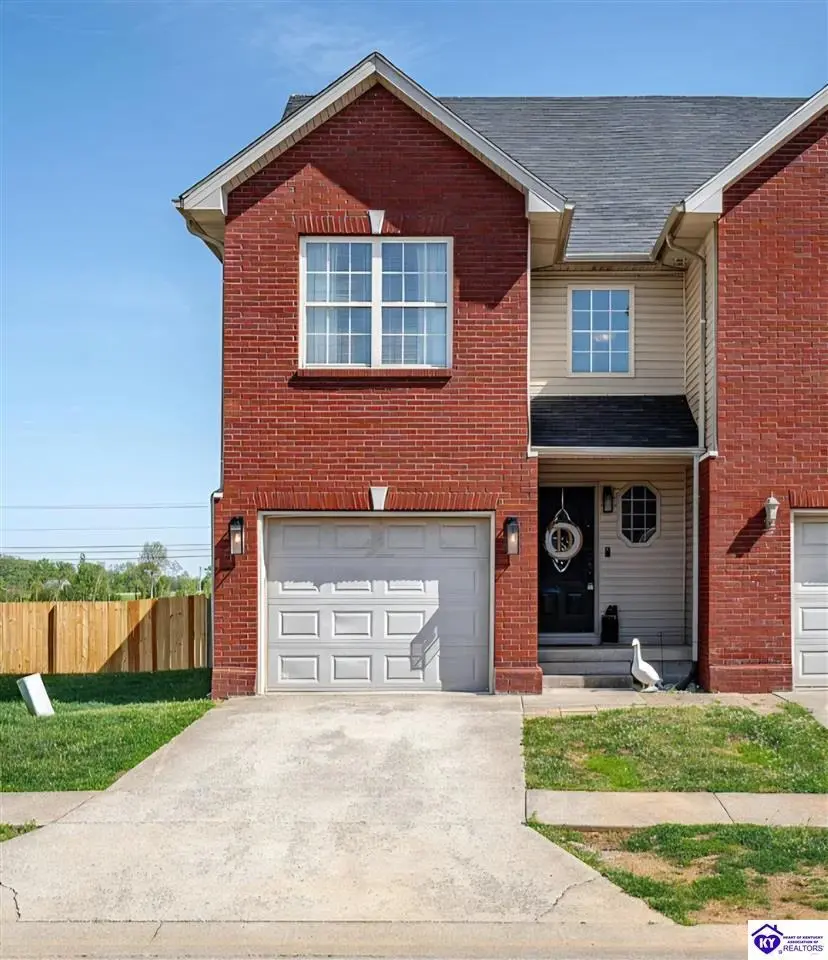
153 Twin Lakes Dr · Vine Grove, KY
Flood risk 1/10 · Minimal
- FEMA flood zone
- X (unshaded)
- Chance of flooding over 30 yrs
- 0.0%
- Est. flood insurance / yr
- $507 – $1,088
Fire risk 3/10 · Minor
- Est. fire insurance / yr
- $839 – $1,559
Heat risk 5/10 · Moderate
- Hot days now (above 104°F)
- 7 days/yr
- Hot days in 30 yrs
- 19 days/yr
Wind risk 2/10 · Minimal
- Chance of severe wind over 30 yrs
- 2.0%
Air-quality risk 2/10 · Minimal
- Unhealthy air days now
- 0 days/yr
- Unhealthy air days in 30 yrs
- 1 days/yr
Risk factors via First Street. Map © Google.
Why this score? — see what drove the D- grade
The composite is a weighted blend of 9 inputs, each scored 0–100. Each bar is that input's sub-score; the figure is the points it added to the 100-point composite (weight × sub-score).
- Cash flow +13.4/30.0
- ARV discount +7.5/15.0
- DSCR +4.0/10.0
- Livability +3.6/5.0
- Schools +3.2/10.0
- 1% rule +2.7/10.0
- Rent growth +2.5/5.0
- Condition / age +2.5/5.0
- Appreciation +0.0/10.0
$224,900
🖨 Deal sheet 📄 Offer letter ✓ Due diligence
Listing remarks MLS
Very Nice & Well Maintained- 3 bedroom, 2.5 bath Townhome in the Highland Springs Subdivision. This end unit provides a little breathing room and additional yard space! The recently stained HUGE back deck looks great and will provide endless hours of enjoyment. Interior has all new carpet upstairs and the stairwell. Newer vinyl flooring on the main level. Washer and Dryer to stay with home, new dishwasher. 5 minutes to Ft. Knox, Shopping & Restaurants in E-town, & Approx. 10 minutes to I-65. Great Location!
Key facts
- Private garage
- Updated interior
- 4,792 sq ft lot
Tags
Property features AI
Finance
- Other: Rental allowed
- HOA & community: Subdivision: HIGHLAND SPRINGS; Association fee listed as $0
Exterior
- Parking: Attached 1-car garage
- Utilities: Electricity connected
- Home design: Single family residence; 2 stories; Architectural style: Other
- Construction: Built in 2006; Vinyl siding and brick exterior; Shingle roof; Crawl space foundation with concrete block
- Exterior features: Sidewalk along the lot; Privacy wood fencing enclosing the yard (full wood fence)
Interior
- Kitchen: Kitchen on the first floor; Dining area adjacent to the kitchen on the first floor
- Bedrooms: 3 bedrooms total; Primary bedroom on the second floor; All bedrooms located on the second floor
- Bathrooms: 2 full bathrooms; 1 half bathroom; Primary bathroom on the second floor; Half bathroom on the first floor; Full bathrooms located on the second floor
- Heating & cooling: Electric heating with a heat pump; Central air conditioning; One HVAC unit for heating and one for cooling
- Interior features: Foyer; Living room; Dining area; Total of 11 rooms; 5 total rooms (primary living breakdown); 5 closets; No basement
- Laundry & utility: Laundry room on the first floor; First-floor laundry
Neighborhood map
What this means for you Summary
Snapshot
- This is a 3-bed/2.5-bath condo listed at $225k.
Deal economics
- At list price, monthly cash flow is $5 ($63/yr) — positive.
- The deal already cash-flows at list — no discount required.
- To meet the 1% rule (rent ≥ 1% of price), the offer needs to be $174k (22.8% below list).
- Recommended offer: $174k (22.8% below list) — sets the bar for 1% rule.
- Cap rate 6.3% vs local median 4.0% in Vine Grove — top-decile yield for the area; either an underpriced asset or a hidden risk that comps aren't pricing in. Stress-test before assuming the spread holds.
Location & tenants
- Location reads 72/100 on livability (#124 in KY) — a middle-class / working-renter tenant base. Strengths: crime A+, cost of living A+, housing A+; Watch: amenities F, commute F, health & safety F.
- Hardin County (suburban): math 30% / reading 43% proficiency, ranked #47 of 165 in KY (top 28%) — families likely to look elsewhere, expect single-tenant / working-renter base with shorter leases.
- Market conditions: 155 active listings in the ZIP; 2 comparable units currently listed for rent nearby; 946 units permitted in Hardin County in 2024 (464 in 5+ unit buildings).
Forward outlook
- Local home prices are declining (-3.0%/yr); year-one equity from $2k of loan paydown is wiped out by about $7k of value loss. Plan a longer hold.
- Hardin County population projected at -16% by 2050 — secular population decline; favor cash flow + early exit over multi-decade hold.
Negotiation context
- Only 7 days on market — expect competitive offers; lowballing is unlikely to land.
- 8 sale attempts since 19y ago with the ask held roughly flat each time — persistent listings suggest the price (not the market) is what's stuck; bring a comps-based counter.
- Current owner paid $117k; list at $225k implies a 92% gain — meaningful room to come down on a strong offer.
Risks & watch-outs
- Climate carrying-cost: extreme-heat days projected 7→19/yr by 2055 (HVAC capex compounding) — expect insurance premiums to compound above CPI over the hold.
Questions for the listing agent
- Any open or pending special assessments — roof, HVAC, plumbing, elevator, façade? What's the per-unit balance and payoff schedule, and is the seller paying it off at close or rolling it to the buyer?
- Is there a deadline driving the sale (1031 exchange, divorce, estate, relocation)? That informs how much negotiation room exists.
- The area grade is low — what's the realistic commute time and amenity access for the typical tenant pool here? Any planned neighborhood developments (good or bad) we should know about?
- What's the average days-on-market for RENTAL listings here right now (not sales)? A rising rental-DOM trend means longer vacancies and softer asking-rent achievability than the comps imply.
- What's the recent tenant-quality profile in this submarket — average credit score on applications, eviction rate, late-payment / NSF rate, and stable-employment percentage? A property-management company in the area should have these aggregated.
- How much new apartment / multifamily construction is in the pipeline within 1–3 miles? Heavy new supply (>2% of stock underway) typically softens rents 12–24 months out; light construction supports rent growth.
Investment metrics
- 1% rule
- 0.77% ✗
- Cap rate
- 6.32%
- Cash-on-cash
- 0.10%
- DSCR
- 1.00
- GRM
- 10.8
CMA / ARV
No comps found within radius.
Projected returns pro-forma
-3.0% appreciation · 3.0% rent growth · sell at horizon
- IRR
- -16.2%
- Equity multiple
- 0.43×
- Total profit
- $-36,198
- Equity at exit
- $33,533
- IRR
- -8.0%
- Equity multiple
- 0.50×
- Total profit
- $-31,451
- Equity at exit
- $19,445
Cash invested: $62,972 (down + closing). Projections, not guarantees.
Landlord ↔ Tenant lean methodology
- Overall (STATE)
- 83 Strongly Landlord-Friendly
- State Kentucky
- 83 Strongly Landlord-Friendly · R+16
- County
- — inherits STATE
- City
- — inherits STATE
ZIP-level market 40175
- Home prices YoY
- -6.3%
- Active inventory
- 155
- Price-to-rent
- 10.8×
Monthly cashflow live
- Estimated rent
- $1,737 medium interval (Pro) →
- Mortgage (P&I)
- −$1,179
- Tax from tax record
- −$94 /mo · $1,128/yr
- Insurance
- −$94
- HOA
- −$0
- Vacancy / Maint / Mgmt
- −$365
- Net cashflow
- $5
Break-even live
UW: 25.0% down · 7.5% · 30yr · 1.5% tax · 5.0% vac · 8.0% maint · 8.0% mgmt
Financing live
Cash to close
- Down payment
- $56,225
- Closing costs
- $6,747
- Reserves months
- —
- Total cash needed
- —
Loan-product check · same deal, 3 products live
Conventional
25% down · 7.5% · 30yr
- Down + closing
- —
- Monthly P&I
- —
- Monthly cashflow
- —
- DSCR
- —
- Eligible?
- —
Personal DTI + credit; lowest rate.
DSCR
20% down · 8.5% · 30yr
- Down + closing
- —
- Monthly P&I
- —
- Monthly cashflow
- —
- DSCR
- —
- Eligible?
- —
No personal income docs; deal must DSCR.
Hard money
10% down · 12.0% · 12mo
- Down + closing
- —
- Monthly P&I
- —
- Monthly cashflow
- —
- DSCR
- —
- Eligible?
- —
Short-term bridge; refi at stabilization.
Rent comps 2 comps
| Address | Beds | Baths | Sqft | Rent | $/sqft | DOM | Units | Dist |
|---|---|---|---|---|---|---|---|---|
| 811 Cedarcrest Dr Vine Grove, KY | 4.0 | 2.0 | 1674 | $1,850 | $1.11 | 44d | 1 | 0.65mi |
| 139 S Red Oak Ct Radcliff, KY | 2.0–3.0 | 2.0–3.0 | 1425 | $1,549 | $1.09 | 44d | 2 | 1.27mi |
HOA detail condo
- Monthly dues
- $0 · $0/yr
- Assessments
- None detected in remarks — confirm with the listing agent.
Listing history 18 events
-
2026-04-29status Pending
-
2026-04-22$224,900 Active
-
2019-04-16soldstatus $117,000
-
2019-04-12soldstatus $117,000 529-char remark
Show marketing remark (529 chars)
Very Nice & Well Maintained- 3 bedroom, 2.5 bath Townhome in the Highland Springs Subdivision. This end unit provides a little breathing room and additional yard space! The recently stained HUGE back deck looks great and will provide endless hours of enjoyment. Interior has all new carpet upstairs and the stairwell. Newer vinyl flooring on the main level. Washer and Dryer to stay with home, new dishwasher. 5 minutes to Ft. Knox, Shopping & Restaurants in E-town, & Approx. 10 minutes to I-65. Great Location!
-
2019-01-09$117,900 529-char remark
Show marketing remark (529 chars)
Very Nice & Well Maintained- 3 bedroom, 2.5 bath Townhome in the Highland Springs Subdivision. This end unit provides a little breathing room and additional yard space! The recently stained HUGE back deck looks great and will provide endless hours of enjoyment. Interior has all new carpet upstairs and the stairwell. Newer vinyl flooring on the main level. Washer and Dryer to stay with home, new dishwasher. 5 minutes to Ft. Knox, Shopping & Restaurants in E-town, & Approx. 10 minutes to I-65. Great Location!
-
2018-11-30historical
-
2018-08-01$120,000
-
2015-12-29soldstatus $83,500
-
2015-12-28soldstatus $83,500
-
2015-12-22soldstatus $83,500
-
2015-02-02$88,900
-
2015-01-29$88,900
-
2014-04-24soldstatus $58,800
-
2014-03-18$89,100
-
2014-03-13historical
-
2013-12-11$89,100
-
2008-03-19historical
-
2007-03-19$109,900
ⓘ Source: listings_history table (triggers on properties + properties_extension) + one-shot
backfill from property_details.listing_events for pre-trigger history.
Tax reassessment forecast KY · Resets to sale price
- Current annual tax
- $1,128 · $94/mo
- Projected year-2 tax
- $1,934 · $161/mo
- Expected delta
- +$806/yr (+$67/mo · 71.5%)
ⓘ Screening estimate from a state-policy table — verify with the county assessor before closing.
Climate risk First Street
- Flood 1/10 Low FEMA zone X (unshaded) · 0% chance over 30 yrs
- Wildfire 3/10 Moderate
- Heat 5/10 Major 7 d/yr ≥104°F today · 19 d/yr by 30 yrs out
- Wind 2/10 Low 2% chance of damaging wind over 30 yrs
- Air quality 2/10 Low 0 unhealthy d/yr today · 1 by 30 yrs out
Nearby sold comps map
Loading sold comps map…
Walkable amenities ~0.75 mi
Loading nearby amenities…
Taxation est. · year 1
- Rental income
- $20,846
- − Mortgage interest
- −$12,598
- − Property taxes
- −$1,128
- − Insurance
- −$1,124
- − Repairs & maintenance
- −$1,668
- − Management
- −$1,668
- − Depreciation
- −$6,543
- Taxable loss
- −$3,882
- Est. tax savings @ 24.0%
- +$932
- After-tax cash flow
- $995/yr
For passive investors: Depreciation is non-cash, so a rental often shows a tax loss while cash-flowing — sheltering income. Rental losses are passive: they offset passive income freely, and up to $25,000/yr can offset ordinary (W-2) income if you actively participate and your MAGI is under $100k (phasing out to $0 by $150k); unused losses carry forward. On sale, claimed depreciation is recaptured at up to 25%, and gains may owe capital-gains tax (a 1031 exchange can defer both). Figures are a year-1 estimate at your 24.0% rate — not tax advice; consult a CPA.
Schools (NCES district)
- District
- Hardin County
- NCES district ID
- 2102490
- Math proficiency
- 30% ▼ -13.00%
- Reading proficiency
- 43% ▼ -10.00%
- Median HH income
- $50,728
- Composite
- 31.61/100
- National rank
- #5945
- State rank
- #47 of 165 in KY
Livability — Vine Grove
- Score
- 72/100
- State rank
- #124
- US rank
- #5837
Category grades
Schools grade is shown separately in the Schools card above.
Census & demographics
- Census place
- Vine Grove, KY
- Population (ZIP)
- 16,283
Population outlook (Hardin County) Hauer SSP2
- Today (2025)
- 105,573 people
- By 2030
- 103,563 · -1.9%
- By 2040
- 97,077 · -8.0%
- By 2050
- 88,367 · -16.3%
- By 2075
- 65,405 · -38.0%
- By 2100
- 42,245 · -60.0%
Race, ethnicity, and origin ACS 2023
- Neighborhood character
- Predominantly White (81%)
- Race & ethnicity
- White 81% Black 9% Two or more races 7% Hispanic / Latino 2% Asian 2%
- Common ancestry
- Italian 2% Slovak 2% Serbian 1%
- Foreign-born
- 3% · South Korea, Canada
- Languages at home
- 95% English-only · Spanish 2% Tagalog/Filipino 1% German/W. Germanic 1%
Political lean MEDSL · Hardin
- 2024 margin
- Strong R (+29.3) · D 34.5% · R 63.8% · Other 1.7%
- 2008→2024 swing
- -8.7pp toward R · 2008: -20.6pp · 2024: -29.3pp
- All cycles
- 2024: R+29.3 2020: R+24.0 2016: R+30.2 2012: R+20.8 2008: R+20.6
Not yet ingested
- Civics
- —
Market trends
- HPI YoY
- ▼ -16.55%
- Current HPI
- 246.3715
- Rent YoY
- —
- Metro
- —
- State GDP YoY
- ▲ 1.81%
- F500 in state
- 4
Industry mix (Fortune 500 HQ in KY)
| Industry | F500 HQs | Revenue |
|---|---|---|
| Healthcare | 1 | $118B |
|
||
| Food / Beverage | 1 | $7B |
|
||
Price history
+104.6% since first listed18 events — show timeline
- 2026-04-29 Pending — Metro Search MLS
- 2026-04-22 Listed $224,900 Metro Search MLS
- 2019-04-16 Sold (Public Records) $117,000 Public Records
- 2019-04-12 Sold (MLS) $117,000 HKARMLS
- 2019-01-09 Listed $117,900 HKARMLS
- 2018-11-30 Listing Removed — Metro Search MLS
- 2018-08-01 Listed $120,000 Metro Search MLS
- 2015-12-29 Sold (Public Records) $83,500 Public Records
- 2015-12-28 Sold (MLS) $83,500 Metro Search MLS
- 2015-12-22 Sold (MLS) $83,500 HKARMLS
- 2015-02-02 Listed $88,900 Metro Search MLS
- 2015-01-29 Listed $88,900 HKARMLS
- 2014-04-24 Sold (MLS) $58,800 Metro Search MLS
- 2014-03-18 Listed $89,100 Metro Search MLS
- 2014-03-13 Listing Removed — Metro Search MLS
- 2013-12-11 Listed $89,100 Metro Search MLS
- 2008-03-19 Listing Removed — Metro Search MLS
- 2007-03-19 Listed $109,900 Metro Search MLS
Property tax history
+2.8%/yrLatest (2025): $1,128 · +0.8% YoY. Source: county tax records.
Cash-flow waterfall
monthlySold comps — $/sqft
last 12 mo · ≤1 miLoading sold comps…