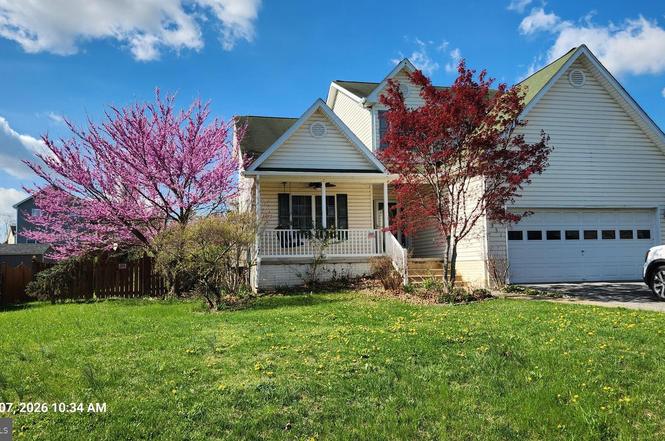
351 Thumper Dr
Ranson, WV 25438
$344,000D+
3 bd · 3.5 ba ·
2,566 sqft ·
Built 2005
· SingleFamily
· Pending
· 100 DOM
Cashflow @ list (25.0% down · 7.5%)
Estimated rent
$2,241/mo
Mortgage (P&I)
−$1,804
Tax + insurance
−$414
HOA
−$30
Vac / Maint / Mgmt
−$471
Net cashflow
$-478/mo
Annual
$-5,731/yr
Cap rate
4.63%
Cash-on-cash
-5.95%
DSCR
0.74
1% rule
0.65%
Cash to close
$96,320
Investor read
- This is a 3-bed/3.5-bath single-family listed at $344k.
- At list price, monthly cash flow is $-478 ($-6k/yr) — negative.
- To cash-flow at today's rent, offer at most $260k (24.5% below list).
- To meet the 1% rule (rent ≥ 1% of price), the offer needs to be $224k (34.8% below list).
- It's been on market 100 days — a 9% lower offer ($313k) is reasonable based on typical stale-listing flexibility.
- Recommended offer: $224k (34.8% below list) — sets the bar for 1% rule.
- In year one you build about $37k of equity ($2k loan paydown + $34k appreciation (10.0% local appreciation)).
- Location reads 66/100 on livability (#100 in WV) — a middle-class / working-renter tenant base. Strengths: crime A+, housing A+, cost of living A-; Watch: schools F, amenities F, commute F.
- Jefferson County Schools (rural): math 29% / reading 46% proficiency, ranked #6 of 55 in WV (top 11%) — families likely to look elsewhere, expect single-tenant / working-renter base with shorter leases.
- Market conditions: 311 active listings in the ZIP; 6 comparable units currently listed for rent nearby; rentals leasing fast (median 13d on market — plan ~1-2 weeks tenant-placement turnaround); solid renter incomes; 1,162 units permitted in Jefferson County in 2024 (360 in 5+ unit buildings).
- Jefferson County population projected at +13% by 2050 — modest demand growth; plan on rents tracking national, not racing it.
- 4 sale attempts since 17y ago with the ask held roughly flat each time — persistent listings suggest the price (not the market) is what's stuck; bring a comps-based counter.
- By year 2, paydown + projected appreciation supports a ~$59k cash-out refi (75% LTV) — recoverable capital for the next deal without selling this one.
- Climate carrying-cost: extreme-heat days projected 7→16/yr by 2055 (HVAC capex compounding) — expect insurance premiums to compound above CPI over the hold.
- Cap rate 4.6% vs local median 3.8% in Ranson — meaningfully above typical; check what's discounted (condition, days-on-market, listing class) to confirm the premium yield is real.
- This rent runs 33% of the median local income ($82k/yr) — at the standard rent-burdened threshold; future hikes will face affordability resistance.
Questions for listing agent
- What do current leases actually rent for vs. the listed asking? Can we see a recent rent roll and the last 12 months of T-12 income?
- It's been on market 100 days. Have you received any prior offers? Is the seller open to a 35% concession, seller financing, or rate buy-down credit?
- What does the HOA fee cover, when was the last increase, and are there any pending special assessments or reserve-fund shortfalls?
- Why hasn't it sold? Are there any deal-killer items the seller is aware of (foundation, flood, title, zoning, code violations)?
- Is there a deadline driving the sale (1031 exchange, divorce, estate, relocation)? That informs how much negotiation room exists.
- Schools are F-rated, which usually means shorter tenancies and higher turnover. Who's the typical renter profile here, and what's been the actual vacancy rate?
- The area grade is low — what's the realistic commute time and amenity access for the typical tenant pool here? Any planned neighborhood developments (good or bad) we should know about?
- What's the average days-on-market for RENTAL listings here right now (not sales)? A rising rental-DOM trend means longer vacancies and softer asking-rent achievability than the comps imply.
CashFlowRE · CFR-2K1SDB1RG38D85
· Data 1 week ago
cashflowre.app · 2026-05-29