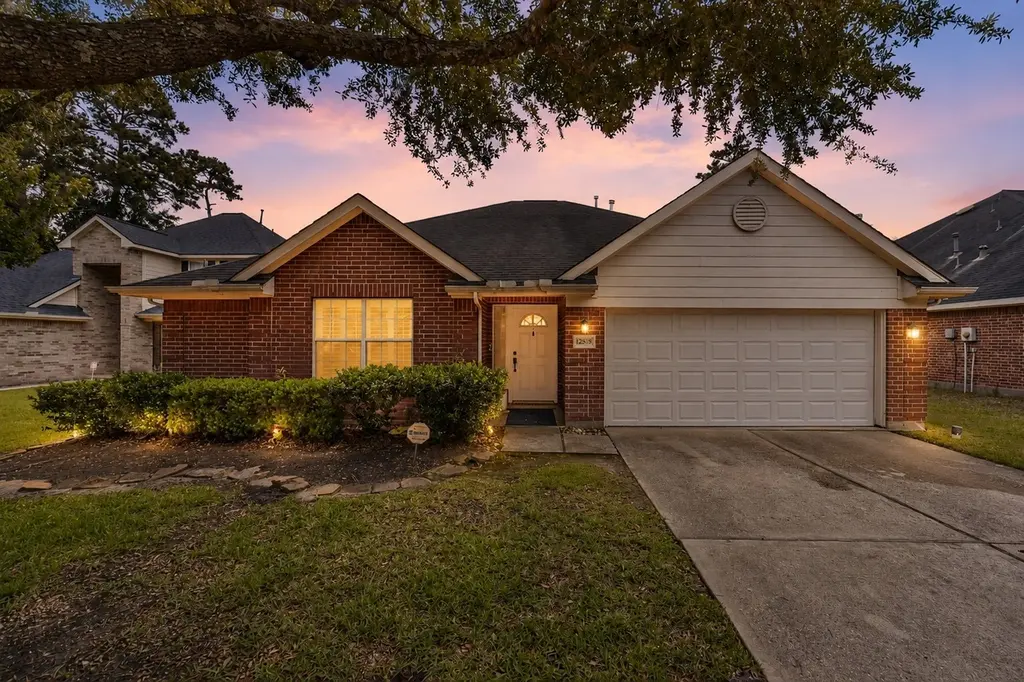
12838 Cooper Breaks Dr
Atascocita, TX 77346
$218,500D+
3 bd · 2.0 ba ·
1,838 sqft ·
Built 2005
· SingleFamily
· Pending
· 12 DOM
Cashflow @ list (25.0% down · 7.5%)
Estimated rent
$2,279/mo
Mortgage (P&I)
−$1,146
Tax + insurance
−$751
HOA
−$92
Vac / Maint / Mgmt
−$479
Net cashflow
$-188/mo
Annual
$-2,262/yr
Cap rate
5.26%
Cash-on-cash
-3.70%
DSCR
0.84
1% rule
1.04%
Cash to close
$61,180
Investor read
- This is a 3-bed/2.0-bath single-family listed at $218k.
- At list price, monthly cash flow is $-188 ($-2k/yr) — negative.
- To cash-flow at today's rent, offer at most $185k (15.2% below list).
- Meets the 1% rule at list price ($2k rent vs $218k).
- Only 12 days on market — expect competitive offers; lowballing is unlikely to land.
- Recommended offer: $185k (15.2% below list) — sets the bar for cash-flow.
- Local home prices are declining (-0.9%/yr); year-one equity from $2k of loan paydown is wiped out by about $2k of value loss. Plan a longer hold.
- Location reads 70/100 on livability (#346 in TX) — a middle-class / working-renter tenant base. Strengths: employment A+, cost of living A+, housing A+; Watch: amenities F, commute F, health & safety F.
- Humble ISD (urban): math 38% / reading 44% proficiency, ranked #262 of 826 in TX (top 32%) — families likely to look elsewhere, expect single-tenant / working-renter base with shorter leases.
- Zoned schools: Eagle Springs El (math 55% / reading 53%, grade C, #664 of 4,322 statewide, top 16%, 688 students, 30% FRL); Timberwood Middle (math 31% / reading 46%, grade F, #704 of 1,662 statewide, top 43%, 1,094 students, 54% FRL); Humble H S (math 15% / reading 31%, grade F, #1,348 of 1,632 statewide, top 83%, 2,867 students, 77% FRL) — zoned schools average 54% FRL vs 32% district-wide (21 pts higher); higher-poverty schools than district average — tighter screening recommended.
- Watch-outs: property tax is 3.6% of price.
- Market conditions: Rents flat; 682 active listings in the ZIP; 28 comparable units currently listed for rent nearby; rentals leasing fast (median 14d on market — plan ~1-2 weeks tenant-placement turnaround); high-income renter base; 29,883 units permitted in Harris County in 2024 (8,621 in 5+ unit buildings).
- Harris County population projected at +47% by 2050 — long-run rental-demand tailwind backs the buy-and-hold thesis.
- 2 sale attempts since 13y ago with the ask held roughly flat each time — persistent listings suggest the price (not the market) is what's stuck; bring a comps-based counter.
- Climate carrying-cost: severe wind risk, 99% chance of damaging wind over 30y; extreme-heat days projected 7→24/yr by 2055 (HVAC capex compounding) — expect insurance premiums to compound above CPI over the hold.
- Cap rate 5.3% vs local median 4.0% in Atascocita — top-decile yield for the area; either an underpriced asset or a hidden risk that comps aren't pricing in. Stress-test before assuming the spread holds.
Questions for listing agent
- What do current leases actually rent for vs. the listed asking? Can we see a recent rent roll and the last 12 months of T-12 income?
- Property tax is high relative to price — has the assessment been appealed recently, and will the sale trigger a re-assessment?
- What does the HOA fee cover, when was the last increase, and are there any pending special assessments or reserve-fund shortfalls?
- Is there a deadline driving the sale (1031 exchange, divorce, estate, relocation)? That informs how much negotiation room exists.
- The area grade is low — what's the realistic commute time and amenity access for the typical tenant pool here? Any planned neighborhood developments (good or bad) we should know about?
- What's the average days-on-market for RENTAL listings here right now (not sales)? A rising rental-DOM trend means longer vacancies and softer asking-rent achievability than the comps imply.
- What's the recent tenant-quality profile in this submarket — average credit score on applications, eviction rate, late-payment / NSF rate, and stable-employment percentage? A property-management company in the area should have these aggregated.
- How much new for-sale + rental construction is in the pipeline within 1–3 miles? Heavy new supply typically softens prices + rents 12–24 months out; constrained supply supports both.
CashFlowRE · CFR-2MGRBVBV9KD3R6
· Data 4 weeks ago
cashflowre.app · 2026-05-29