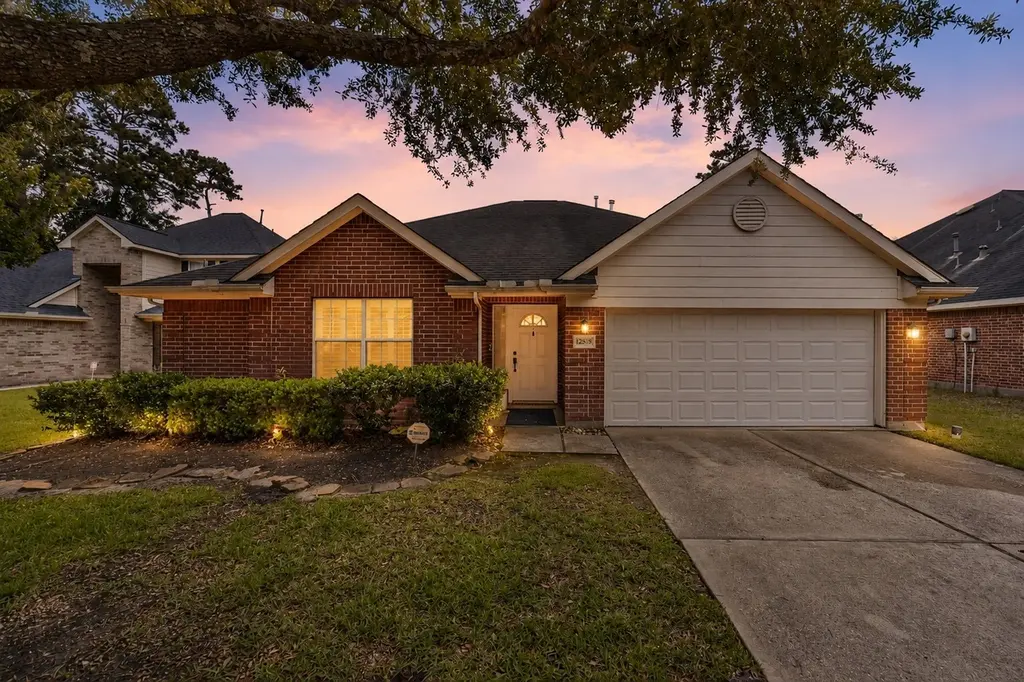
12838 Cooper Breaks Dr · Atascocita, TX
Flood risk 1/10 · Minimal
- FEMA flood zone
- X (unshaded)
- Chance of flooding over 30 yrs
- 0.0%
- Est. flood insurance / yr
- $507 – $1,088
Fire risk 1/10 · Minimal
- Est. fire insurance / yr
- $1,222 – $2,270
Heat risk 9/10 · Severe
- Hot days now (above 111°F)
- 7 days/yr
- Hot days in 30 yrs
- 24 days/yr
Wind risk 9/10 · Severe
- Chance of severe wind over 30 yrs
- 99.0%
Air-quality risk 3/10 · Minor
- Unhealthy air days now
- 3 days/yr
- Unhealthy air days in 30 yrs
- 3 days/yr
Risk factors via First Street. Map © Google.
Why this score? — see what drove the D+ grade
The composite is a weighted blend of 9 inputs, each scored 0–100. Each bar is that input's sub-score; the figure is the points it added to the 100-point composite (weight × sub-score).
- ARV discount +15.0/15.0
- Cash flow +8.6/30.0
- 1% rule +5.4/10.0
- Appreciation +4.5/10.0
- Schools +3.9/10.0
- Livability +3.5/5.0
- Rent growth +2.5/5.0
- Condition / age +2.5/5.0
- DSCR +2.4/10.0
$218,500
🖨 Deal sheet (PDF) 📄 Offer letter ✓ Due diligence
Listing remarks
What a lovely Eagle Springs beauty. Home offers beautiful wood floors, plantation shutters, washer, dryer and fridge included, fireplace in large living area, neutral paint colors throughout. Large kitchen with eat in breakfast area, breakfast bar, crown molding, great split floorplan. Home has some deferred maintenance original roof and ac's, price reflects condition. Large primary bedroom, bath and closet. Great backyard.
Key facts
- 7,675 sq ft lot
- 2 garage spots
- Community pool
Property features AI
Finance
- HOA & community: Association: ESCA/Crest; Annual association fee of $1,100; Association maintains clubhouse, common areas, and recreation facilities; Community amenities include clubhouse, fitness center, lake/pond, meeting/party room, picnic area, playground, pickleball, pool, tennis courts, and trails; Community pool
Exterior
- Parking: Attached 2-car garage; Garage door opener
- Security: Owned security system; Smoke detectors
- Utilities: Public water; Public sewer
- Home design: Residential property; Faces north; Built in 2005; Slab foundation
- Construction: Brick, cement siding, and wood siding construction; Composition roof
- Exterior features: Deck; Porch; Patio; Private yard; Fence (back yard); Sprinkler/irrigation; Pond on lot; Subdivision setting
Interior
- Kitchen: Dishwasher; Disposal; Gas oven; Gas range; Microwave; Refrigerator; ENERGY STAR qualified appliances
- Bedrooms: Total rooms: 8
- Flooring: Tile flooring; Wood flooring
- Bathrooms: 2 full bathrooms; Double vanity; Jetted tub; Separate shower
- Heating & cooling: Central heating (gas); Central electric air conditioning; Programmable thermostat
- Interior features: Breakfast bar; Crown molding; Double vanity; Entrance foyer; High ceilings; Jetted tub; Kitchen/family room combo; Pantry; Separate shower; Window treatments; Ceiling fans; Kitchen/dining combo; Programmable thermostat; Low emissivity windows; Window coverings; Gas fireplace (1)
- Laundry & utility: Washer and dryer included; Washer hookup; Electric dryer hookup
Neighborhood map
What this means for you Summary
Snapshot
- This is a 3-bed/2.0-bath single-family listed at $218k.
Deal economics
- At list price, monthly cash flow is $-188 ($-2k/yr) — negative.
- To cash-flow at today's rent, offer at most $185k (15.2% below list).
- Meets the 1% rule at list price ($2k rent vs $218k).
- Recommended offer: $185k (15.2% below list) — sets the bar for cash-flow.
- Cap rate 5.3% vs local median 4.0% in Atascocita — top-decile yield for the area; either an underpriced asset or a hidden risk that comps aren't pricing in. Stress-test before assuming the spread holds.
Location & tenants
- Location reads 70/100 on livability (#346 in TX) — a middle-class / working-renter tenant base. Strengths: employment A+, cost of living A+, housing A+; Watch: amenities F, commute F, health & safety F.
- Humble ISD (urban): math 38% / reading 44% proficiency, ranked #262 of 826 in TX (top 32%) — families likely to look elsewhere, expect single-tenant / working-renter base with shorter leases.
- Zoned schools: Eagle Springs El (math 55% / reading 53%, grade C, #664 of 4,322 statewide, top 16%, 688 students, 30% FRL); Timberwood Middle (math 31% / reading 46%, grade F, #704 of 1,662 statewide, top 43%, 1,094 students, 54% FRL); Humble H S (math 15% / reading 31%, grade F, #1,348 of 1,632 statewide, top 83%, 2,867 students, 77% FRL) — zoned schools average 54% FRL vs 32% district-wide (21 pts higher); higher-poverty schools than district average — tighter screening recommended.
- Market conditions: Rents flat; 682 active listings in the ZIP; 28 comparable units currently listed for rent nearby; rentals leasing fast (median 14d on market — plan ~1-2 weeks tenant-placement turnaround); high-income renter base; 29,883 units permitted in Harris County in 2024 (8,621 in 5+ unit buildings).
Forward outlook
- Local home prices are declining (-0.9%/yr); year-one equity from $2k of loan paydown is wiped out by about $2k of value loss. Plan a longer hold.
- Harris County population projected at +47% by 2050 — long-run rental-demand tailwind backs the buy-and-hold thesis.
Negotiation context
- Only 12 days on market — expect competitive offers; lowballing is unlikely to land.
- 2 sale attempts since 13y ago with the ask held roughly flat each time — persistent listings suggest the price (not the market) is what's stuck; bring a comps-based counter.
Risks & watch-outs
- Watch-outs: property tax is 3.6% of price.
- Climate carrying-cost: severe wind risk, 99% chance of damaging wind over 30y; extreme-heat days projected 7→24/yr by 2055 (HVAC capex compounding) — expect insurance premiums to compound above CPI over the hold.
Questions for the listing agent
- What do current leases actually rent for vs. the listed asking? Can we see a recent rent roll and the last 12 months of T-12 income?
- Property tax is high relative to price — has the assessment been appealed recently, and will the sale trigger a re-assessment?
- What does the HOA fee cover, when was the last increase, and are there any pending special assessments or reserve-fund shortfalls?
- Is there a deadline driving the sale (1031 exchange, divorce, estate, relocation)? That informs how much negotiation room exists.
- The area grade is low — what's the realistic commute time and amenity access for the typical tenant pool here? Any planned neighborhood developments (good or bad) we should know about?
- What's the average days-on-market for RENTAL listings here right now (not sales)? A rising rental-DOM trend means longer vacancies and softer asking-rent achievability than the comps imply.
- What's the recent tenant-quality profile in this submarket — average credit score on applications, eviction rate, late-payment / NSF rate, and stable-employment percentage? A property-management company in the area should have these aggregated.
- How much new for-sale + rental construction is in the pipeline within 1–3 miles? Heavy new supply typically softens prices + rents 12–24 months out; constrained supply supports both.
Investment metrics
- 1% rule
- 1.04% ✓
- Cap rate
- 5.26%
- Cash-on-cash
- -3.70%
- DSCR
- 0.84
- GRM
- 8.0
CMA / ARV
- ARV (on-the-fly)
- $286,728
- Comps found
- 12
Show comp detail 12 sales within ~0.75 mi
| Address | Dist | Beds/Ba | Sqft | Sold | Price | $/sf | Match |
|---|---|---|---|---|---|---|---|
| 12838 Cooper Breaks Dr | 0.00mi | 3/2.0 | 1,898 (+3%) | 1mo | $218,500 | $115 | 94 |
| 12810 Whistling Springs Dr | 0.26mi | 3/2.0 | 1,935 (+5%) | 2mo | $314,990 | $163 | 78 |
| 12818 Ribbon Meadow Ct | 0.35mi | 3/2.0 | 1,941 (+6%) | 0mo | $287,500 | $148 | 74 |
| 17919 Eagle Pass Falls Ct | 0.24mi | 3/2.0 | 1,734 (-6%) | 8mo | $277,000 | $160 | 73 |
| 18102 Pagemill Point Ln | 0.45mi | 3/2.0 | 1,817 (-1%) | 7mo | $275,000 | $151 | 72 |
| 12735 Whistling Springs Dr | 0.26mi | 3/2.0 | 1,729 (-6%) | 8mo | $270,000 | $156 | 71 |
| 7115 Rose Village Dr | 0.70mi | 3/2.0 | 1,900 (+3%) | 2mo | $255,000 | $134 | 61 |
| 17918 Eagle Pass Falls Ct | 0.23mi | 3/2.0 | 1,573 (-14%) | 6mo | $260,000 | $165 | 60 |
| 6715 Rockwall Trail Dr | 0.55mi | 4/2.0 (+1) | 1,842 (+0%) | 10mo | $269,000 | $146 | 60 |
| 17114 Upper Ridge Ln | 0.73mi | 3/2.0 | 1,779 (-3%) | 2mo | $295,000 | $166 | 59 |
| 18434 Yellowstone Trl | 0.73mi | 3/2.0 | 1,854 (+1%) | 7mo | $270,000 | $146 | 59 |
| 13203 Davenport Hills Ln | 0.73mi | 3/2.0 | 1,617 (-12%) | 1mo | $280,000 | $173 | 45 |
Match score weights: distance 35% · size 25% · config 20% · recency 20%. Top-matched comps best support the ARV.
Projected returns pro-forma
-0.95% appreciation · 0.09% rent growth · sell at horizon
- IRR
- -13.3%
- Equity multiple
- 0.44×
- Total profit
- $-34,159
- Equity at exit
- $53,224
- IRR
- -10.2%
- Equity multiple
- 0.17×
- Total profit
- $-50,704
- Equity at exit
- $56,300
Cash invested: $61,180 (down + closing). Projections, not guarantees.
Landlord ↔ Tenant lean methodology
- Overall (STATE)
- 87 Strongly Landlord-Friendly
- State Texas
- 87 Strongly Landlord-Friendly · R+5
- County
- — inherits STATE
- City
- — inherits STATE
ZIP-level market 77346
- Home prices YoY
- -0.4%
- Rents YoY
- 0.1%
- Active inventory
- 682
- Price-to-rent
- 8.0×
Monthly cashflow live
- Estimated rent
- $2,279 high interval (Pro) →
- Mortgage (P&I)
- −$1,146
- Tax from tax record
- −$660 /mo · $7,919/yr
- Insurance
- −$91
- HOA
- −$92
- Vacancy / Maint / Mgmt
- −$479
- Net cashflow
- $-188
Break-even live
Sensitivity live
| Price | -10% $-65 | -5% $-127 | +0% $-188 | +5% $-250 | +10% $-312 |
|---|---|---|---|---|---|
| Rent | -10% $-369 | -5% $-278 | +0% $-188 | +5% $-98 | +10% $-8 |
| Rate | -1.0pp $-78 | -0.5pp $-133 | base $-188 | +0.5pp $-245 | +1.0pp $-303 |
UW: 25.0% down · 7.5% · 30yr · 1.5% tax · 5.0% vac · 8.0% maint · 8.0% mgmt
Financing live
Cash to close
- Down payment
- $54,625
- Closing costs
- $6,555
- Reserves months
- —
- Total cash needed
- —
Loan-product check · same deal, 3 products live
Conventional
25% down · 7.5% · 30yr
- Down + closing
- —
- Monthly P&I
- —
- Monthly cashflow
- —
- DSCR
- —
- Eligible?
- —
Personal DTI + credit; lowest rate.
DSCR
20% down · 8.5% · 30yr
- Down + closing
- —
- Monthly P&I
- —
- Monthly cashflow
- —
- DSCR
- —
- Eligible?
- —
No personal income docs; deal must DSCR.
Hard money
10% down · 12.0% · 12mo
- Down + closing
- —
- Monthly P&I
- —
- Monthly cashflow
- —
- DSCR
- —
- Eligible?
- —
Short-term bridge; refi at stabilization.
Rent comps 28 comps
| Address | Beds | Baths | Sqft | Rent | $/sqft | DOM | Units | Dist |
|---|---|---|---|---|---|---|---|---|
| 17923 Diamond Peak Ct Humble, TX | 4.0 | 2.0 | 2171 | $2,306 | $1.06 | 0d | 1 | 0.25mi |
| 17417 W Lake Houston Pkwy Humble, TX | 1.0–2.0 | 1.0–2.0 | 956 | $1,795 | $1.88 | 0d | 12 | 0.27mi |
| 17401 W Lake Houston Pkwy Humble, TX | 1.0–3.0 | 1.0–2.0 | 1085 | $2,139 | $1.97 | 0d | 41 | 0.39mi |
| 17571 W Lake Houston Pkwy Humble, TX | 2.0 | 1.0–2.0 | 922 | $2,000 | $2.17 | 0d | 41 | 0.46mi |
| 18103 Yellowstone Trl Humble, TX | 4.0 | 2.5 | 2602 | $2,371 | $0.91 | 45d | 1 | 0.48mi |
| 17260 W Lake Houston Pkwy Atascocita, TX | 1.0–3.0 | 1.0–2.5 | 1065 | $2,470 | $2.32 | 0d | 12 | 0.58mi |
| 12643 Jamestown Crossing Ln Humble, TX | 4.0 | 2.0 | 2450 | $4,995 | $2.04 | 26d | 1 | 0.59mi |
| 16848 W Lake Houston Pkwy Humble, TX | 3.0 | 1.0–2.5 | 1128 | $2,563 | $2.27 | 0d | 24 | 0.70mi |
| 7315 Wisteria Chase Pl Humble, TX | 3.0 | 2.0 | 1232 | $1,232 | $1.00 | 21d | 1 | 0.88mi |
| 16755 W Lake Houston Pkwy Unit 16788 Houston, TX | 3.0 | 2.0 | 1433 | $1,934 | $1.35 | 45d | 1 | 0.89mi |
| 16755 W Lake Houston Pkwy Unit 3174 Houston, TX | 3.0 | 2.0 | 1433 | $1,775 | $1.24 | 12d | 1 | 0.89mi |
| 16755 W Lake Houston Pkwy Unit 3148 Houston, TX | 3.0 | 2.0 | 1433 | $1,735 | $1.21 | 0d | 1 | 0.89mi |
| 13513 Northline Lake Dr Houston, TX | 3.0 | 3.0 | 2034 | $2,800 | $1.38 | 45d | 1 | 0.95mi |
| 12323 Crescent Mountain Ln Humble, TX | 3.0 | 2.5 | 2358 | $2,231 | $0.95 | 0d | 1 | 1.01mi |
| 18810 Woodbreeze Dr Humble, TX | 4.0 | 2.5 | 2200 | $2,279 | $1.04 | 26d | 1 | 1.02mi |
| 7002 Echo Pines Dr Humble, TX | 3.0 | 2.0 | 1738 | $1,869 | $1.08 | 17d | 1 | 1.03mi |
| 12214 Landsdown Ridge Way Humble, TX | 4.0 | 2.5 | 2389 | $2,165 | $0.91 | 13d | 1 | 1.05mi |
| 16807 Hemlock Grove Dr Humble, TX | 4.0 | 3.0 | 2476 | $3,100 | $1.25 | 45d | 1 | 1.08mi |
| 14100 Will Clayton Pkwy Unit 3165 Humble, TX | 3.0 | 2.0 | 1393 | $1,859 | $1.33 | 0d | 1 | 1.12mi |
| 14100 Will Clayton Pkwy Unit 3174 Humble, TX | 3.0 | 2.0 | 1393 | $1,910 | $1.37 | 12d | 1 | 1.12mi |
| 14100 Will Clayton Pkwy Unit 14133 Humble, TX | 3.0 | 2.0 | 1393 | $1,910 | $1.37 | 45d | 1 | 1.12mi |
| 16614 Spirit Lake Ct Houston, TX | 3.0 | 2.5 | 2374 | $2,395 | $1.01 | 26d | 1 | 1.14mi |
| 18123 Noble Forest Dr Humble, TX | 4.0 | 2.5 | 2328 | $2,595 | $1.11 | 7d | 1 | 1.16mi |
| 14100 Will Clayton Pkwy Humble, TX | 1.0–3.0 | 1.0–2.0 | 1040 | $1,910 | $1.84 | 14d | 1 | 1.18mi |
| 17834 Yellow Birch Trl Humble, TX | 3.0 | 2.0 | 1532 | $1,646 | $1.07 | 45d | 1 | 1.23mi |
| 7515 Echo Pines Dr Humble, TX | 3.0 | 2.0 | 1655 | $1,850 | $1.12 | 45d | 1 | 1.32mi |
| 7131 Maple Walk Dr Humble, TX | 3.0 | 2.0 | 1808 | $1,895 | $1.05 | 7d | 1 | 1.42mi |
| 18030 June Forest Dr Humble, TX | 4.0 | 2.5 | 2341 | $2,156 | $0.92 | 0d | 1 | 1.45mi |
HOA detail
- Monthly dues
- $92 · $1,104/yr
Listing history 9 events
-
2026-05-23status Pending
-
2026-05-15status Pending
-
2026-05-11$218,500 Active
-
2025-11-05soldstatus
-
2013-08-13soldstatus
-
2013-08-09soldstatus Sold
-
2013-07-15status Pending
-
2013-07-10status Option Pending
-
2013-06-27$162,500 Active
ⓘ Source: listings_history table (triggers on properties + properties_extension) + one-shot
backfill from property_details.listing_events for pre-trigger history.
Tax reassessment forecast TX · Resets to sale price
- Current annual tax
- $7,919 · $660/mo
- Projected year-2 tax
- $7,919 · $660/mo
- Expected delta
- $0/yr ($0/mo · 0.0%)
ⓘ Screening estimate from a state-policy table — verify with the county assessor before closing.
Climate risk First Street
- Flood 1/10 Low FEMA zone X (unshaded) · 0% chance over 30 yrs
- Wildfire 1/10 Low
- Heat 9/10 Extreme 7 d/yr ≥111°F today · 24 d/yr by 30 yrs out
- Wind 9/10 Extreme 99% chance of damaging wind over 30 yrs
- Air quality 3/10 Moderate 3 unhealthy d/yr today · 3 by 30 yrs out
Nearby sold comps map
Loading sold comps map…
Walkable amenities ~0.75 mi
Loading nearby amenities…
Taxation est. · year 1
- Rental income
- $27,347
- − Mortgage interest
- −$12,239
- − Property taxes
- −$7,919
- − Insurance
- −$1,092
- − Repairs & maintenance
- −$2,188
- − Management
- −$2,188
- − HOA
- −$1,104
- − Depreciation
- −$6,356
- Taxable loss
- −$5,740
- Est. tax savings @ 24.0%
- +$1,378
- After-tax cash flow
- $-884/yr
For passive investors: Depreciation is non-cash, so a rental often shows a tax loss while cash-flowing — sheltering income. Rental losses are passive: they offset passive income freely, and up to $25,000/yr can offset ordinary (W-2) income if you actively participate and your MAGI is under $100k (phasing out to $0 by $150k); unused losses carry forward. On sale, claimed depreciation is recaptured at up to 25%, and gains may owe capital-gains tax (a 1031 exchange can defer both). Figures are a year-1 estimate at your 24.0% rate — not tax advice; consult a CPA.
Schools (NCES district)
- District
- Humble ISD
- NCES district ID
- 4823910
- Math proficiency
- 38% ▼ -11.00%
- Reading proficiency
- 44% ▼ -7.00%
- Median HH income
- $83,946
- Composite
- 38.55/100
- National rank
- #4171
- State rank
- #262 of 826 in TX
Livability — Atascocita
- Score
- 70/100
- State rank
- #346
- US rank
- #7586
Category grades
Schools grade is shown separately in the Schools card above.
Census & demographics
- Census place
- Atascocita, TX
- County
- Harris County · 4,702,590 people
- City population
- 79,538
- Metro
- Houston-The Woodlands-Sugar Land, TX
- Population (ZIP)
- 79,538
- Household income
- $122,241
- Rent vs Own
- Severe rent burden
- 1072.0
Population outlook (Harris County) Hauer SSP2
- Today (2025)
- 5,571,493 people
- By 2030
- 6,089,821 · +9.3%
- By 2040
- 7,142,806 · +28.2%
- By 2050
- 8,185,864 · +46.9%
- By 2075
- 10,574,329 · +89.8%
- By 2100
- 12,109,958 · +117.4%
Race, ethnicity, and origin ACS 2023
- Neighborhood character
- Diverse neighborhood (Simpson 0.70)
- Race & ethnicity
- White 42% Hispanic / Latino 28% Black 21% Two or more races 18% Asian 4%
- Hispanic origin (detail)
- Mexican 20% Puerto Rican 2%
- Common ancestry
- Lithuanian 4% Slovak 1% Italian 1%
- Foreign-born
- 10% · Canada, Vietnam, China
- Languages at home
- 78% English-only · Spanish 17% Other Indo-European 1% German/W. Germanic 1%
Political lean MEDSL · Harris
- 2024 margin
- Lean D (+5.5) · D 52.0% · R 46.4% · Other 1.6%
- 2008→2024 swing
- +3.9pp toward D · 2008: 1.6pp · 2024: 5.5pp
- All cycles
- 2024: D+5.5 2020: D+13.3 2016: D+12.4 2012: D+0.1 2008: D+1.6
Not yet ingested
- Civics
- —
Market trends
- HPI YoY
- ▼ -0.95%
- Current HPI
- 218.0478
- Rent YoY
- ▲ 0.09%
- Metro
- Houston-The Woodlands-Sugar Land, TX
- State GDP YoY
- ▲ 3.95%
- F500 in state
- 110
Industry mix (Fortune 500 HQ in TX)
| Industry | F500 HQs | Revenue |
|---|---|---|
| Energy | 16 | $1,198B |
|
||
| Technology | 5 | $198B |
|
||
| Engineering / Construction | 4 | $72B |
|
||
| Energy Services | 3 | $60B |
|
||
| Utilities | 3 | $41B |
|
||
| Healthcare | 2 | $330B |
|
||
Price history
+34.5% since first listed9 events — show timeline
- 2026-05-23 Pending — HARMLS
- 2026-05-15 Pending — HARMLS
- 2026-05-11 Listed $218,500 HARMLS
- 2025-11-05 Sold (Public Records) — Public Records
- 2013-08-13 Sold (Public Records) — Public Records
- 2013-08-09 Sold (MLS) — HARMLS
- 2013-07-15 Pending — HARMLS
- 2013-07-10 Pending — HARMLS
- 2013-06-27 Listed $162,500 HARMLS
Property tax history
+2.9%/yrLatest (2025): $7,919 · +7.0% YoY. Source: county tax records.
Cash-flow waterfall
monthlySold comps — $/sqft
last 12 mo · ≤1 miLoading sold comps…