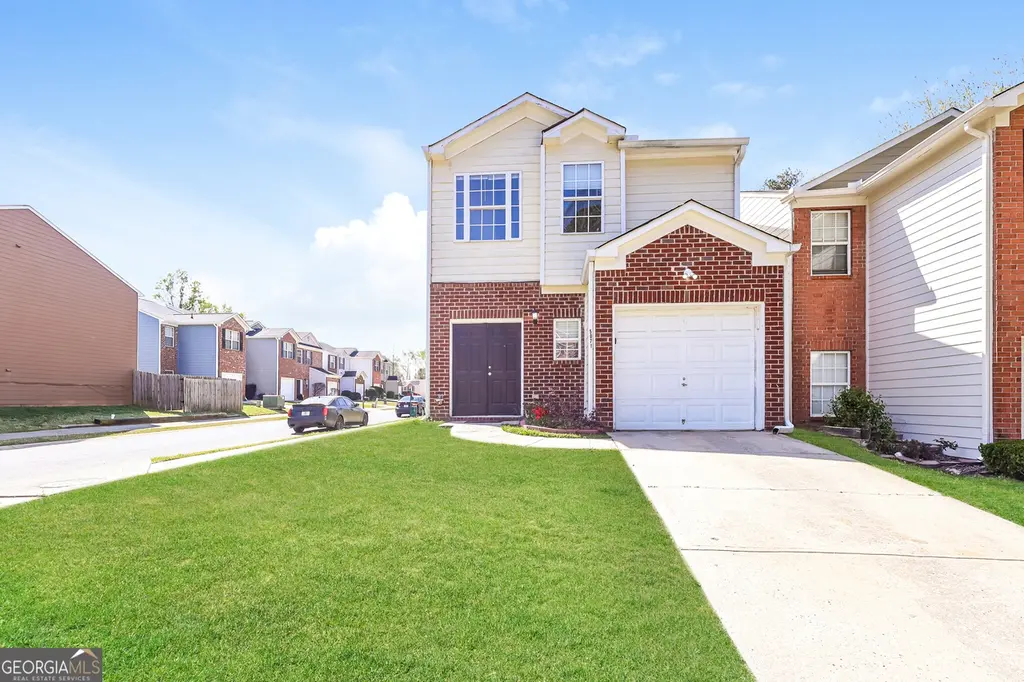
5071 Windsor Forrest Ln
College Park, GA 30349
$223,091C-
3 bd · 2.5 ba ·
1,303 sqft ·
Built 2002
· SingleFamily
· Active
· 27 DOM
Cashflow @ list (25.0% down · 7.5%)
Estimated rent
$1,778/mo
Mortgage (P&I)
−$1,170
Tax + insurance
−$267
HOA
−$0
Vac / Maint / Mgmt
−$373
Net cashflow
$-32/mo
Annual
$-385/yr
Cap rate
6.12%
Cash-on-cash
-0.62%
DSCR
0.97
1% rule
0.80%
Cash to close
$62,465
Investor read
- This is a 3-bed/2.5-bath single-family listed at $223k.
- At list price, monthly cash flow is $-32 ($-385/yr) — negative.
- To cash-flow at today's rent, offer at most $217k (2.5% below list).
- To meet the 1% rule (rent ≥ 1% of price), the offer needs to be $178k (20.3% below list).
- It's been on market 27 days — a 2% lower offer ($220k) is reasonable based on typical stale-listing flexibility.
- Recommended offer: $178k (20.3% below list) — sets the bar for 1% rule.
- In year one you build about $24k of equity ($2k loan paydown + $22k appreciation (10.0% local appreciation)).
- Location reads 59/100 on livability (#408 in GA) — a working-class tenant base; expect higher turnover. Strengths: commute A+, cost of living A+, housing A-; Watch: schools F, crime F, amenities F.
- Fulton County (suburban): math 49% / reading 53% proficiency, ranked #12 of 174 in GA (top 7%) — acceptable for families but not a draw, mixed tenant base, ~2y average lease.
- Market conditions: Rents flat; 651 active listings in the ZIP; 33 comparable units currently listed for rent nearby; rentals at typical pace (median 25d on market — plan ~3-4 weeks tenant-placement turnaround); 45% of comp listings sitting > 30 days — soft ceiling on asking rent; 11,565 units permitted in Fulton County in 2024 (8,159 in 5+ unit buildings).
- Fulton County population projected at +38% by 2050 — long-run rental-demand tailwind backs the buy-and-hold thesis.
- 7 sale attempts since 5y ago with the ask held roughly flat each time — persistent listings suggest the price (not the market) is what's stuck; bring a comps-based counter.
- At projected returns (10.0% appreciation + 0.9% rent growth), your $62k cash investment doubles in ~3 years — after that, you're playing with house money.
- By year 2, paydown + projected appreciation supports a ~$38k cash-out refi (75% LTV) — recoverable capital for the next deal without selling this one.
- Cap rate 6.1% vs local median 3.8% in College Park — top-decile yield for the area; either an underpriced asset or a hidden risk that comps aren't pricing in. Stress-test before assuming the spread holds.
- This rent runs 32% of the median local income ($67k/yr) — at the standard rent-burdened threshold; future hikes will face affordability resistance.
Questions for listing agent
- What do current leases actually rent for vs. the listed asking? Can we see a recent rent roll and the last 12 months of T-12 income?
- Is there a deadline driving the sale (1031 exchange, divorce, estate, relocation)? That informs how much negotiation room exists.
- Schools are F-rated, which usually means shorter tenancies and higher turnover. Who's the typical renter profile here, and what's been the actual vacancy rate?
- Crime grade is F in this area — have there been break-ins, vandalism, or insurance claims at this property in the last 3 years? What carrier currently insures it and at what premium?
- What's the average days-on-market for RENTAL listings here right now (not sales)? A rising rental-DOM trend means longer vacancies and softer asking-rent achievability than the comps imply.
- What's the recent tenant-quality profile in this submarket — average credit score on applications, eviction rate, late-payment / NSF rate, and stable-employment percentage? A property-management company in the area should have these aggregated.
- How much new for-sale + rental construction is in the pipeline within 1–3 miles? Heavy new supply typically softens prices + rents 12–24 months out; constrained supply supports both.
CashFlowRE · CFR-2Q89820J0ST2TZ
· Data 2 weeks ago
cashflowre.app · 2026-05-29