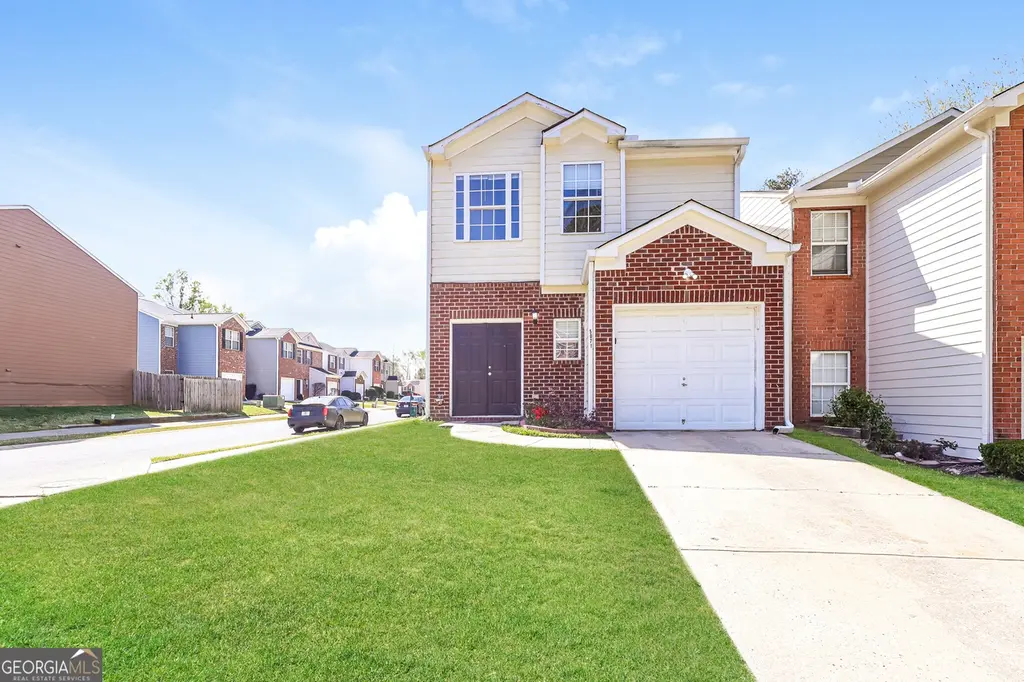
5071 Windsor Forrest Ln · College Park, GA
Flood risk No data
- FEMA flood zone
- —
- Chance of flooding over 30 yrs
- —
- Est. flood insurance / yr
- —
Fire risk No data
- Est. fire insurance / yr
- —
Heat risk No data
- Hot days now (above threshold)
- —
- Hot days in 30 yrs
- —
Wind risk No data
- Chance of severe wind over 30 yrs
- —
Air-quality risk No data
- Unhealthy air days now
- —
- Unhealthy air days in 30 yrs
- —
Risk factors via First Street. Map © Google.
Why this score? — see what drove the C- grade
The composite is a weighted blend of 9 inputs, each scored 0–100. Each bar is that input's sub-score; the figure is the points it added to the 100-point composite (weight × sub-score).
- Cash flow +12.5/30.0
- ARV discount +10.5/15.0
- Appreciation +10.0/10.0
- Schools +4.5/10.0
- DSCR +3.7/10.0
- 1% rule +3.0/10.0
- Livability +3.0/5.0
- Rent growth +2.7/5.0
- Condition / age +2.5/5.0
$223,091
🖨 Deal sheet (PDF) 📄 Offer letter ✓ Due diligence
Listing remarks MLS
SELLER IS NOT ACCEPTING OFFERS / NO SHOWINGS!
Key facts
- Fully fenced yard
- Corner lot
- Local parks
Tags
Neighborhood map
What this means for you Summary
Snapshot
- This is a 3-bed/2.5-bath single-family listed at $223k.
Deal economics
- At list price, monthly cash flow is $-32 ($-385/yr) — negative.
- To cash-flow at today's rent, offer at most $217k (2.5% below list).
- To meet the 1% rule (rent ≥ 1% of price), the offer needs to be $178k (20.3% below list).
- Recommended offer: $178k (20.3% below list) — sets the bar for 1% rule.
- Cap rate 6.1% vs local median 3.8% in College Park — top-decile yield for the area; either an underpriced asset or a hidden risk that comps aren't pricing in. Stress-test before assuming the spread holds.
Location & tenants
- Location reads 59/100 on livability (#408 in GA) — a working-class tenant base; expect higher turnover. Strengths: commute A+, cost of living A+, housing A-; Watch: schools F, crime F, amenities F.
- Fulton County (suburban): math 49% / reading 53% proficiency, ranked #12 of 174 in GA (top 7%) — acceptable for families but not a draw, mixed tenant base, ~2y average lease.
- Market conditions: Rents flat; 651 active listings in the ZIP; 33 comparable units currently listed for rent nearby; rentals at typical pace (median 25d on market — plan ~3-4 weeks tenant-placement turnaround); 45% of comp listings sitting > 30 days — soft ceiling on asking rent; 11,565 units permitted in Fulton County in 2024 (8,159 in 5+ unit buildings).
- This rent runs 32% of the median local income ($67k/yr) — at the standard rent-burdened threshold; future hikes will face affordability resistance.
Forward outlook
- In year one you build about $24k of equity ($2k loan paydown + $22k appreciation (10.0% local appreciation)).
- Fulton County population projected at +38% by 2050 — long-run rental-demand tailwind backs the buy-and-hold thesis.
- At projected returns (10.0% appreciation + 0.9% rent growth), your $62k cash investment doubles in ~3 years — after that, you're playing with house money.
- By year 2, paydown + projected appreciation supports a ~$38k cash-out refi (75% LTV) — recoverable capital for the next deal without selling this one.
Negotiation context
- It's been on market 27 days — a 2% lower offer ($220k) is reasonable based on typical stale-listing flexibility.
- 7 sale attempts since 5y ago with the ask held roughly flat each time — persistent listings suggest the price (not the market) is what's stuck; bring a comps-based counter.
Questions for the listing agent
- What do current leases actually rent for vs. the listed asking? Can we see a recent rent roll and the last 12 months of T-12 income?
- Is there a deadline driving the sale (1031 exchange, divorce, estate, relocation)? That informs how much negotiation room exists.
- Schools are F-rated, which usually means shorter tenancies and higher turnover. Who's the typical renter profile here, and what's been the actual vacancy rate?
- Crime grade is F in this area — have there been break-ins, vandalism, or insurance claims at this property in the last 3 years? What carrier currently insures it and at what premium?
- What's the average days-on-market for RENTAL listings here right now (not sales)? A rising rental-DOM trend means longer vacancies and softer asking-rent achievability than the comps imply.
- What's the recent tenant-quality profile in this submarket — average credit score on applications, eviction rate, late-payment / NSF rate, and stable-employment percentage? A property-management company in the area should have these aggregated.
- How much new for-sale + rental construction is in the pipeline within 1–3 miles? Heavy new supply typically softens prices + rents 12–24 months out; constrained supply supports both.
Investment metrics
- 1% rule
- 0.80% ✗
- Cap rate
- 6.12%
- Cash-on-cash
- -0.62%
- DSCR
- 0.97
- GRM
- 10.5
CMA / ARV
- ARV (median comp)
- $238,937
- List price
- $223,091
- Delta
- -6.63%
- Verdict
- FAIR
- Comps
- 20 within 1.0 mi
Show comp detail 4 sales within ~0.75 mi
| Address | Dist | Beds/Ba | Sqft | Sold | Price | $/sf | Match |
|---|---|---|---|---|---|---|---|
| 2833 Windsor Forrest Ct | 0.06mi | 3/2.5 | 1,303 (0%) | 19mo | $184,000 | $141 | 81 |
| 2816 Windsor Forrest Ct | 0.03mi | 3/2.5 | 1,288 (-1%) | 23mo | $145,500 | $113 | 78 |
| 5370 Longmeadow Ln | 0.61mi | 3/1.5 | 1,248 (-4%) | 4mo | $87,500 | $70 | 57 |
| 2760 Swansea Ct | 0.71mi | 4/2.0 (+1) | 1,347 (+3%) | 2mo | $295,900 | $220 | 53 |
Match score weights: distance 35% · size 25% · config 20% · recency 20%. Top-matched comps best support the ARV.
Projected returns pro-forma
10.0% appreciation · 0.95% rent growth · sell at horizon
- IRR
- 23.2%
- Equity multiple
- 2.85×
- Total profit
- $115,827
- Equity at exit
- $200,978
- IRR
- 20.3%
- Equity multiple
- 6.38×
- Total profit
- $335,925
- Equity at exit
- $433,417
Cash invested: $62,465 (down + closing). Projections, not guarantees.
Landlord ↔ Tenant lean methodology
- Overall (STATE)
- 90 Strongly Landlord-Friendly
- State Georgia
- 90 Strongly Landlord-Friendly · R+3
- County
- — inherits STATE
- City
- — inherits STATE
ZIP-level market 30349
- Home prices YoY
- 4.6%
- Rents YoY
- 0.9%
- Active inventory
- 651
- Price-to-rent
- 10.5×
Monthly cashflow live
- Estimated rent
- $1,778 high interval (Pro) →
- Mortgage (P&I)
- −$1,170
- Tax from tax record
- −$174 /mo · $2,083/yr
- Insurance
- −$93
- HOA
- −$0
- Vacancy / Maint / Mgmt
- −$373
- Net cashflow
- $-32
Break-even live
Sensitivity live
| Price | -10% $94 | -5% $31 | +0% $-32 | +5% $-95 | +10% $-158 |
|---|---|---|---|---|---|
| Rent | -10% $-173 | -5% $-102 | +0% $-32 | +5% $38 | +10% $108 |
| Rate | -1.0pp $80 | -0.5pp $25 | base $-32 | +0.5pp $-90 | +1.0pp $-149 |
UW: 25.0% down · 7.5% · 30yr · 1.5% tax · 5.0% vac · 8.0% maint · 8.0% mgmt
Financing live
Cash to close
- Down payment
- $55,773
- Closing costs
- $6,693
- Reserves months
- —
- Total cash needed
- —
Loan-product check · same deal, 3 products live
Conventional
25% down · 7.5% · 30yr
- Down + closing
- —
- Monthly P&I
- —
- Monthly cashflow
- —
- DSCR
- —
- Eligible?
- —
Personal DTI + credit; lowest rate.
DSCR
20% down · 8.5% · 30yr
- Down + closing
- —
- Monthly P&I
- —
- Monthly cashflow
- —
- DSCR
- —
- Eligible?
- —
No personal income docs; deal must DSCR.
Hard money
10% down · 12.0% · 12mo
- Down + closing
- —
- Monthly P&I
- —
- Monthly cashflow
- —
- DSCR
- —
- Eligible?
- —
Short-term bridge; refi at stabilization.
Rent comps 33 comps
| Address | Beds | Baths | Sqft | Rent | $/sqft | DOM | Units | Dist |
|---|---|---|---|---|---|---|---|---|
| 2817 Windsor Forrest Ct Atlanta, GA | 3.0 | 2.5 | 1408 | $1,697 | $1.21 | 44d | 1 | 0.03mi |
| 5071 Windsor Forrest Ln Atlanta, GA | 3.0 | 2.5 | 1303 | $1,881 | $1.44 | 13d | 1 | 0.03mi |
| 2835 Windsor Forrest Ct Atlanta, GA | 3.0 | 2.5 | 1680 | $1,881 | $1.12 | 6d | 1 | 0.06mi |
| 2883 Windsor Forrest Ct Atlanta, GA | 3.0 | 2.5 | 1115 | $1,895 | $1.70 | 2d | 1 | 0.17mi |
| 3100 Godby Rd Atlanta, GA | 1.0–2.0 | 1.0–2.5 | 959 | $1,395 | $1.45 | 2d | 34 | 0.18mi |
| 3110 Godby Rd Unit 15a College Park, GA | 2.0 | 1.5 | 1062 | $1,150 | $1.08 | 3d | 1 | 0.20mi |
| 3110 Godby Rd Unit 5d College Park, GA | 2.0 | 2.0 | 1016 | $1,150 | $1.13 | 2d | 1 | 0.20mi |
| 5194 Seaside Ct Atlanta, GA | 4.0 | 2.5 | 1765 | $2,135 | $1.21 | 25d | 1 | 0.25mi |
| 2710 Dunmoreland Ter Atlanta, GA | 3.0 | 1.0 | 1198 | $1,540 | $1.29 | 44d | 1 | 0.45mi |
| 5380 Sand Bar Ln Atlanta, GA | 3.0 | 2.0 | 1361 | $1,961 | $1.44 | 4d | 1 | 0.46mi |
| 5370 Longmeadow Ln Atlanta, GA | 3.0 | 2.0 | 1248 | $1,600 | $1.28 | 17d | 1 | 0.63mi |
| 2431 Old National Pkwy College Park, GA | 1.0–3.0 | 1.0–2.0 | 1031 | $1,780 | $1.73 | 2d | 1 | 0.72mi |
| 2601 Roosevelt Hwy Atlanta, GA | 3.0 | 1.0–2.5 | 1000 | $1,550 | $1.55 | 2d | 9 | 0.77mi |
| 2890 Jerome Rd Atlanta, GA | 3.0 | 1.5 | 1229 | $1,761 | $1.43 | 44d | 1 | 0.86mi |
| 2301 Godby Rd Atlanta, GA | 2.0 | 1.0 | 1054 | $1,225 | $1.16 | 44d | 1 | 0.89mi |
| 4609 Hopewell Rd Atlanta, GA | 3.0 | 2.0 | 1563 | $2,200 | $1.41 | 44d | 1 | 0.90mi |
| 5410 Twin Lakes Dr Atlanta, GA | 3.0 | 2.0 | 1277 | $2,040 | $1.60 | 44d | 1 | 0.97mi |
| 5645 Deerfield Trl Atlanta, GA | 3.0 | 1.5 | 1496 | $1,495 | $1.00 | 22d | 1 | 0.98mi |
| 5712 Westhill Cir Atlanta, GA | 4.0 | 2.0 | 1441 | $1,710 | $1.19 | 3d | 1 | 1.02mi |
| 4550 Washington Rd Atlanta, GA | 2.0 | 1.5 | 1350 | $1,450 | $1.07 | 44d | 1 | 1.12mi |
| 3369 The Way Pl Atlanta, GA | 3.0 | 2.5 | 1830 | $2,395 | $1.31 | 44d | 1 | 1.12mi |
| 4555 Washington Rd Atlanta, GA | 1.0–2.0 | 1.0–1.5 | 952 | $1,175 | $1.23 | 3d | 15 | 1.18mi |
| 5335 Willow Park Blvd Atlanta, GA | 4.0 | 2.5 | 1716 | $2,000 | $1.17 | 44d | 1 | 1.19mi |
| 2210 Sullivan Rd Atlanta, GA | 1.0–3.0 | 1.0–2.0 | 950 | $1,412 | $1.49 | 2d | 17 | 1.21mi |
| 5460 Hampton Ct Atlanta, GA | 2.0 | 3.5 | 1554 | $1,500 | $0.97 | 44d | 1 | 1.27mi |
| 5442 Scofield Rd Atlanta, GA | 3.0 | 1.5 | 1368 | $1,775 | $1.30 | 44d | 1 | 1.29mi |
| 4395 Washington Rd Atlanta, GA | 1.0–3.0 | 1.0–2.5 | 959 | $1,502 | $1.57 | 44d | 9 | 1.35mi |
| 5690 Hampton Ct Atlanta, GA | 2.0 | 3.0 | 1184 | $1,495 | $1.26 | 44d | 1 | 1.37mi |
| 5515 Scofield Rd Atlanta, GA | 3.0 | 2.0 | 1109 | $1,788 | $1.61 | 11d | 1 | 1.38mi |
| 2500 Pleasant Hill Rd Atlanta, GA | 2.0–3.0 | 1.5–2.5 | 1405 | $1,449 | $1.03 | 25d | 2 | 1.39mi |
| 3364 Estes Dr Atlanta, GA | 3.0 | 2.5 | 1736 | $1,889 | $1.09 | 17d | 1 | 1.40mi |
| 5267 Joan of Arc Pl Atlanta, GA | 3.0 | 1.0 | 1066 | $1,743 | $1.64 | 44d | 1 | 1.43mi |
| 5234 Norman Blvd Atlanta, GA | 3.0 | 2.0 | 1404 | $1,785 | $1.27 | 44d | 1 | 1.49mi |
Listing history 31 events
-
2026-06-04days on market $223,091 Active 27 DOM
-
2026-06-03days on market $223,091 Active 26 DOM
-
2026-06-02remarks 60-char remark
-
2026-06-02days on market $223,091 Active 24 DOM
-
2026-06-01days on market $223,091 Active 56 DOM
-
2026-05-31days on market $223,091 Active 55 DOM
-
2026-04-22price $223,091 45-char remark
Show marketing remark (45 chars)
SELLER IS NOT ACCEPTING OFFERS / NO SHOWINGS!
-
2026-04-22status Active
Show marketing remark (45 chars)
SELLER IS NOT ACCEPTING OFFERS / NO SHOWINGS!
-
2026-04-22price $223,091
Show marketing remark (45 chars)
SELLER IS NOT ACCEPTING OFFERS / NO SHOWINGS!
-
2026-03-30$220,000 Active
Show marketing remark (45 chars)
SELLER IS NOT ACCEPTING OFFERS / NO SHOWINGS!
-
2026-03-30$220,000 New 45-char remark
Show marketing remark (45 chars)
SELLER IS NOT ACCEPTING OFFERS / NO SHOWINGS!
-
2021-08-06soldstatus $195,000
-
2021-07-27soldstatus $195,000 Closed
-
2021-07-27soldstatus $195,000 Sold
-
2021-07-21soldstatus $130,000
-
2021-06-24status Under Contract
-
2021-06-24status Pending
-
2021-06-18$180,000 Active
-
2021-06-18$180,000 New
-
2021-05-28soldstatus $130,000 Closed
-
2021-05-28soldstatus $130,000 Sold
-
2021-04-22status Under Contract
-
2021-04-22status Pending
-
2021-04-21status Pending Offer Approval
-
2021-04-20$119,900 Active
-
2021-04-20$119,900 New
-
2014-03-28soldstatus $173,000
-
2010-10-28historical
-
2010-04-14price $99,000 Reduced
-
2010-04-13price $99,000
-
2005-10-07soldstatus $134,000
ⓘ Source: listings_history table (triggers on properties + properties_extension) + one-shot
backfill from property_details.listing_events for pre-trigger history.
Tax reassessment forecast GA · Resets to sale price
- Current annual tax
- $2,083 · $174/mo
- Projected year-2 tax
- $2,083 · $174/mo
- Expected delta
- $0/yr ($0/mo · 0.0%)
ⓘ Screening estimate from a state-policy table — verify with the county assessor before closing.
Nearby sold comps map
Loading sold comps map…
Walkable amenities ~0.75 mi
Loading nearby amenities…
Taxation est. · year 1
- Rental income
- $21,333
- − Mortgage interest
- −$12,497
- − Property taxes
- −$2,083
- − Insurance
- −$1,115
- − Repairs & maintenance
- −$1,707
- − Management
- −$1,707
- − Depreciation
- −$6,490
- Taxable loss
- −$4,266
- Est. tax savings @ 24.0%
- +$1,024
- After-tax cash flow
- $639/yr
For passive investors: Depreciation is non-cash, so a rental often shows a tax loss while cash-flowing — sheltering income. Rental losses are passive: they offset passive income freely, and up to $25,000/yr can offset ordinary (W-2) income if you actively participate and your MAGI is under $100k (phasing out to $0 by $150k); unused losses carry forward. On sale, claimed depreciation is recaptured at up to 25%, and gains may owe capital-gains tax (a 1031 exchange can defer both). Figures are a year-1 estimate at your 24.0% rate — not tax advice; consult a CPA.
Schools (NCES district)
- District
- Fulton County
- NCES district ID
- 1302280
- Math proficiency
- 49% ▼ -2.00%
- Reading proficiency
- 53% ▬ 0.00%
- Median HH income
- $68,035
- Composite
- 45.33/100
- National rank
- #2640
- State rank
- #12 of 174 in GA
Livability — College Park
- Score
- 59/100
- State rank
- #408
- US rank
- #20212
Category grades
Schools grade is shown separately in the Schools card above.
Census & demographics
- Census place
- College Park, GA
- County
- Fulton County · 1,094,430 people
- City population
- 10,694
- Metro
- Atlanta-Sandy Springs-Alpharetta, GA
- Population (ZIP)
- 79,872
- Household income
- $67,023
- Rent vs Own
- Severe rent burden
- 4258.0
Population outlook (Fulton County) Hauer SSP2
- Today (2025)
- 1,203,707 people
- By 2030
- 1,299,706 · +8.0%
- By 2040
- 1,488,256 · +23.6%
- By 2050
- 1,664,580 · +38.3%
- By 2075
- 2,036,072 · +69.2%
- By 2100
- 2,222,402 · +84.6%
Race, ethnicity, and origin ACS 2023
- Neighborhood character
- Predominantly Black (89%)
- Race & ethnicity
- Black 89% Hispanic / Latino 5% Two or more races 4% White 3%
- Foreign-born
- 9% · Canada
- Languages at home
- 88% English-only · Spanish 6% French/Haitian/Cajun 1%
Political lean MEDSL · Fulton
- 2024 margin
- Solid D (+44.9) · D 71.9% · R 27.0% · Other 1.1%
- 2008→2024 swing
- +9.8pp toward D · 2008: 35.0pp · 2024: 44.9pp
- All cycles
- 2024: D+44.9 2020: D+46.4 2016: D+42.1 2012: D+29.6 2008: D+35.0
Not yet ingested
- Civics
- —
Market trends
- HPI YoY
- ▲ 18.01%
- Current HPI
- 407.99
- Rent YoY
- ▲ 0.95%
- Metro
- Atlanta-Sandy Springs-Alpharetta, GA
- State GDP YoY
- ▲ 2.66%
- F500 in state
- 28
Industry mix (Fortune 500 HQ in GA)
| Industry | F500 HQs | Revenue |
|---|---|---|
| Paper / Packaging | 2 | $29B |
|
||
| Retail | 1 | $160B |
|
||
| Transportation / Logistics | 1 | $91B |
|
||
| Airlines | 1 | $62B |
|
||
| Consumer Goods | 1 | $47B |
|
||
| Utilities | 1 | $25B |
|
||
Price history
+66.5% since first listed25 events — show timeline
- 2026-04-22 Price Changed $223,091 GAMLS
- 2026-04-22 Relisted — FMLS
- 2026-04-22 Price Changed $223,091 FMLS
- 2026-03-30 Listed $220,000 GAMLS
- 2026-03-30 Listed $220,000 FMLS
- 2021-08-06 Sold (Public Records) $195,000 Public Records
- 2021-07-27 Sold (MLS) $195,000 GAMLS
- 2021-07-27 Sold (MLS) $195,000 FMLS
- 2021-07-21 Sold (Public Records) $130,000 Public Records
- 2021-06-24 Pending — GAMLS
- 2021-06-24 Pending — FMLS
- 2021-06-18 Listed $180,000 GAMLS
- 2021-06-18 Listed $180,000 FMLS
- 2021-05-28 Sold (MLS) $130,000 GAMLS
- 2021-05-28 Sold (MLS) $130,000 FMLS
- 2021-04-22 Pending — GAMLS
- 2021-04-22 Pending — FMLS
- 2021-04-21 Pending — GAMLS
- 2021-04-20 Listed $119,900 GAMLS
- 2021-04-20 Listed $119,900 FMLS
- 2014-03-28 Sold (Public Records) $173,000 Public Records
- 2010-10-28 Listing Removed — FMLS
- 2010-04-14 Price Changed $99,000 GAMLS
- 2010-04-13 Price Changed $99,000 FMLS
- 2005-10-07 Sold (Public Records) $134,000 Public Records
Property tax history
+4.7%/yrLatest (2025): $2,083 · -0.0% YoY. Source: county tax records.
Cash-flow waterfall
monthlySold comps — $/sqft
last 12 mo · ≤1 miLoading sold comps…