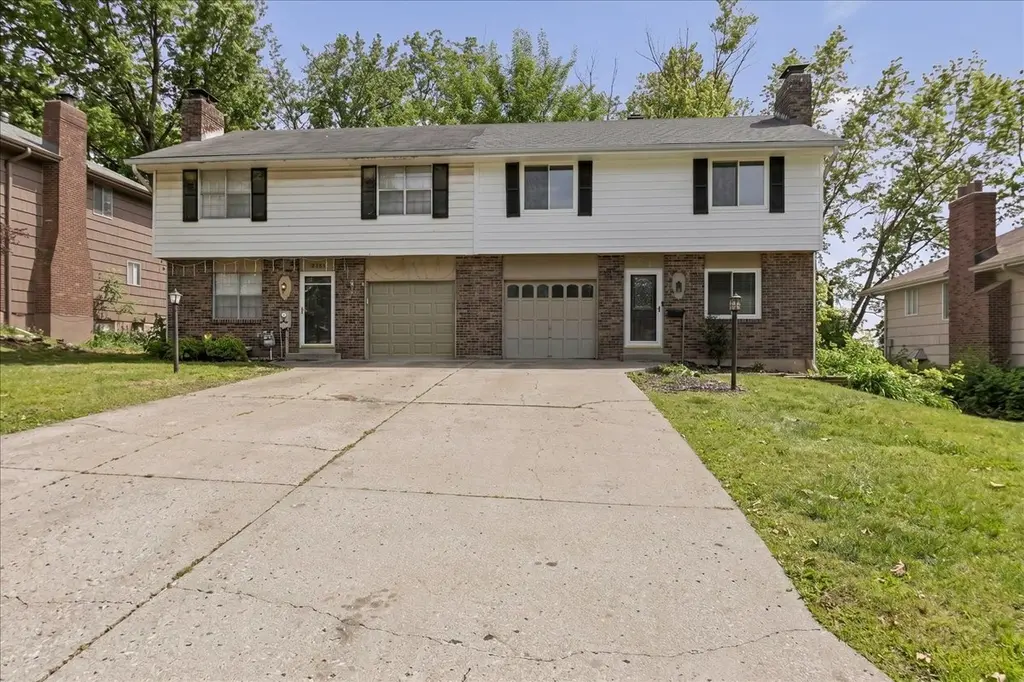
3701 NE 67th St
Gladstone, MO 64119
$210,000D-
3 bd · 2.0 ba ·
1,200 sqft ·
Built 1965
· Townhouse
· Pending
· 12 DOM
Cashflow @ list (25.0% down · 7.5%)
Estimated rent
$1,711/mo
Mortgage (P&I)
−$1,101
Tax + insurance
−$230
HOA
−$51
Vac / Maint / Mgmt
−$359
Net cashflow
$-31/mo
Annual
$-373/yr
Cap rate
6.12%
Cash-on-cash
-0.63%
DSCR
0.97
1% rule
0.81%
Cash to close
$58,800
Investor read
- This is a 3-bed/2.0-bath townhouse listed at $210k.
- At list price, monthly cash flow is $-31 ($-373/yr) — negative.
- To cash-flow at today's rent, offer at most $205k (2.6% below list).
- To meet the 1% rule (rent ≥ 1% of price), the offer needs to be $171k (18.5% below list).
- Only 12 days on market — expect competitive offers; lowballing is unlikely to land.
- Recommended offer: $171k (18.5% below list) — sets the bar for 1% rule.
- Local home prices are declining (-3.0%/yr); year-one equity from $1k of loan paydown is wiped out by about $6k of value loss. Plan a longer hold.
- Location reads 76/100 on livability (#44 in MO, #3,612 nationally) — a middle-class / working-renter tenant base. Strengths: cost of living A+, housing A+, health & safety A+; Watch: crime C-, amenities F, commute F.
- North Kansas City 74 (urban): math 38% / reading 49% proficiency, ranked #98 of 324 in MO (top 30%) — families likely to look elsewhere, expect single-tenant / working-renter base with shorter leases.
- Zoned schools: Chapel Hill Elementary (math 55% / reading 64%, grade B-, #124 of 1,115 statewide, top 13%, 599 students, 40% FRL); Oak Park High (math 36% / reading 56%, grade D-, #170 of 521 statewide, top 33%, 1,756 students, 42% FRL) — zoned schools at 41% FRL track the district average.
- Market conditions: Rents rising fast (+6.1%/yr); 183 active listings in the ZIP; 6 comparable units currently listed for rent nearby; rentals lingering (median 44d on market — plan ~5-8 weeks vacancy on turnover, expect pricing pressure); 50% of comp listings sitting > 30 days — soft ceiling on asking rent; solid renter incomes; 341 units permitted in Clay County in 2024 (40 in 5+ unit buildings).
- Clay County population projected at +24% by 2050 — long-run rental-demand tailwind backs the buy-and-hold thesis.
- 3 sale attempts since 24y ago with the ask held roughly flat each time — persistent listings suggest the price (not the market) is what's stuck; bring a comps-based counter.
- Current owner paid $150k; 40% above their basis — modest negotiation headroom, anchor on the comps not their cost.
- Cap rate 6.1% vs local median 4.4% in Gladstone — top-decile yield for the area; either an underpriced asset or a hidden risk that comps aren't pricing in. Stress-test before assuming the spread holds.
Questions for listing agent
- What do current leases actually rent for vs. the listed asking? Can we see a recent rent roll and the last 12 months of T-12 income?
- Built in 1965 — when were the roof, HVAC, electrical panel, plumbing, and water heater last replaced?
- What does the HOA fee cover, when was the last increase, and are there any pending special assessments or reserve-fund shortfalls?
- Is there a deadline driving the sale (1031 exchange, divorce, estate, relocation)? That informs how much negotiation room exists.
- The area grade is low — what's the realistic commute time and amenity access for the typical tenant pool here? Any planned neighborhood developments (good or bad) we should know about?
- What's the average days-on-market for RENTAL listings here right now (not sales)? A rising rental-DOM trend means longer vacancies and softer asking-rent achievability than the comps imply.
- What's the recent tenant-quality profile in this submarket — average credit score on applications, eviction rate, late-payment / NSF rate, and stable-employment percentage? A property-management company in the area should have these aggregated.
- How much new for-sale + rental construction is in the pipeline within 1–3 miles? Heavy new supply typically softens prices + rents 12–24 months out; constrained supply supports both.
CashFlowRE · CFR-2RHY96AXTDGFAD
· Data 1 week ago
cashflowre.app · 2026-05-29