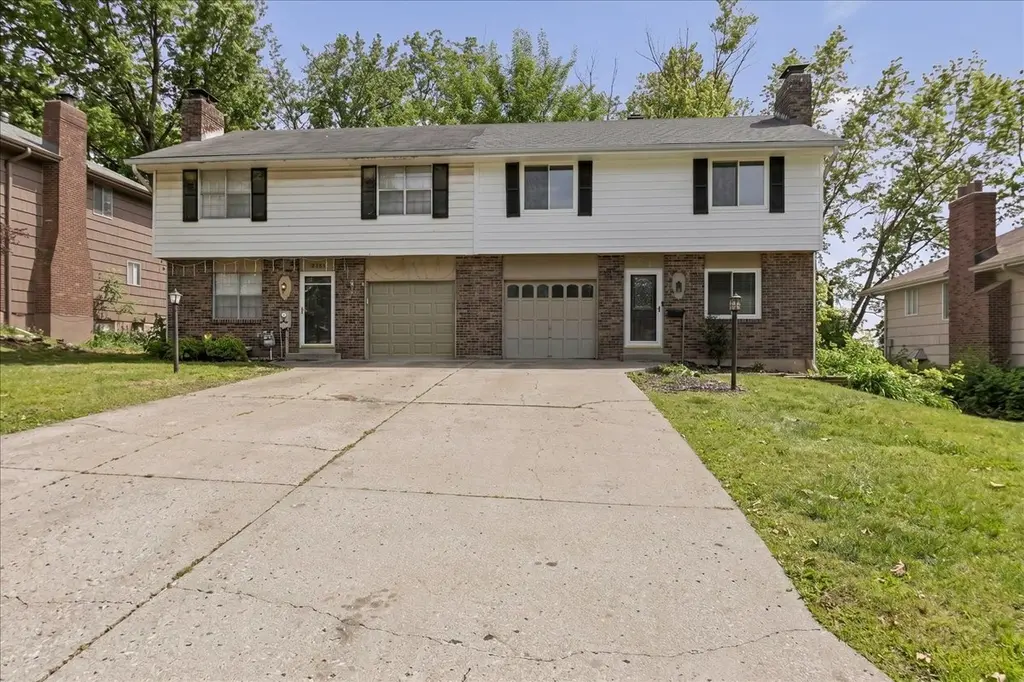
3701 NE 67th St · Gladstone, MO
Flood risk 1/10 · Minimal
- FEMA flood zone
- X (unshaded)
- Chance of flooding over 30 yrs
- 0.0%
- Est. flood insurance / yr
- $473 – $860
Fire risk 2/10 · Minimal
- Est. fire insurance / yr
- $1,054 – $1,958
Heat risk 4/10 · Minor
- Hot days now (above 106°F)
- 7 days/yr
- Hot days in 30 yrs
- 17 days/yr
Wind risk 2/10 · Minimal
- Chance of severe wind over 30 yrs
- —
Air-quality risk 3/10 · Minor
- Unhealthy air days now
- 2 days/yr
- Unhealthy air days in 30 yrs
- 3 days/yr
Risk factors via First Street. Map © Google.
Why this score? — see what drove the D- grade
The composite is a weighted blend of 9 inputs, each scored 0–100. Each bar is that input's sub-score; the figure is the points it added to the 100-point composite (weight × sub-score).
- Cash flow +12.5/30.0
- ARV discount +4.5/15.0
- Rent growth +4.0/5.0
- Schools +3.8/10.0
- Livability +3.8/5.0
- DSCR +3.7/10.0
- 1% rule +3.1/10.0
- Condition / age +2.5/5.0
- Appreciation +0.0/10.0
$210,000
🖨 Deal sheet 📄 Offer letter ✓ Due diligence
Listing remarks MLS
* * * $2500 ALLOWANCE CAN BE USED FOR CARPETING OR CLOSING COSTS * * * $12,000 below appraised value. New roof, new interior paint, newer furnace & A/C, lots of room, possible 4th bedroom downstairs. 2.5 baths. No E-tax in Gladstone. Ideal for larger family or roommates. Basement has a finished room with a closet and full bath. MUST SEE, Real value in this one.
Key facts
- Brick fireplace
- Walk-in closet
- Second living area
Tags
Property features AI
Finance
- HOA & community: HOA with an annual fee of $615; HOA covers curbside recycling, lawn service, and trash
Exterior
- Parking: Built-in garage with garage door opener (garage faces front); 1-car garage
- Security: Smoke detectors
- Utilities: Public water; Public sewer; High-speed internet available
- Home design: Residential half-duplex; Attached property; Two stories; Above-grade finished area approximately 1,200
- Construction: Frame construction; Composition roof
- Exterior features: Patio; Metal fencing; City lot, level
Interior
- Kitchen: Dishwasher; Disposal; Electric range; Eat-in kitchen
- Bedrooms: Three bedrooms (primary and two additional bedrooms are on the second level)
- Flooring: Carpet
- Bathrooms: Two full bathrooms; One half bathroom; Bathroom with ceramic tile and shower-over-tub (second level); Bathroom with shower only (basement)
- Heating & cooling: Natural gas heating; Electric cooling (central)
- Interior features: Ceiling fans; Walk-in closets; Window coverings; Family room and formal living room
- Laundry & utility: Laundry in basement; Laundry in garage
Neighborhood map
What this means for you Summary
Snapshot
- This is a 3-bed/2.0-bath townhouse listed at $210k.
Deal economics
- At list price, monthly cash flow is $-31 ($-373/yr) — negative.
- To cash-flow at today's rent, offer at most $205k (2.6% below list).
- To meet the 1% rule (rent ≥ 1% of price), the offer needs to be $171k (18.5% below list).
- Recommended offer: $171k (18.5% below list) — sets the bar for 1% rule.
- Cap rate 6.1% vs local median 4.4% in Gladstone — top-decile yield for the area; either an underpriced asset or a hidden risk that comps aren't pricing in. Stress-test before assuming the spread holds.
Location & tenants
- Location reads 76/100 on livability (#44 in MO, #3,612 nationally) — a middle-class / working-renter tenant base. Strengths: cost of living A+, housing A+, health & safety A+; Watch: crime C-, amenities F, commute F.
- North Kansas City 74 (urban): math 38% / reading 49% proficiency, ranked #98 of 324 in MO (top 30%) — families likely to look elsewhere, expect single-tenant / working-renter base with shorter leases.
- Zoned schools: Chapel Hill Elementary (math 55% / reading 64%, grade B-, #124 of 1,115 statewide, top 13%, 599 students, 40% FRL); Oak Park High (math 36% / reading 56%, grade D-, #170 of 521 statewide, top 33%, 1,756 students, 42% FRL) — zoned schools at 41% FRL track the district average.
- Market conditions: Rents rising fast (+6.1%/yr); 183 active listings in the ZIP; 6 comparable units currently listed for rent nearby; rentals lingering (median 44d on market — plan ~5-8 weeks vacancy on turnover, expect pricing pressure); 50% of comp listings sitting > 30 days — soft ceiling on asking rent; solid renter incomes; 341 units permitted in Clay County in 2024 (40 in 5+ unit buildings).
Forward outlook
- Local home prices are declining (-3.0%/yr); year-one equity from $1k of loan paydown is wiped out by about $6k of value loss. Plan a longer hold.
- Clay County population projected at +24% by 2050 — long-run rental-demand tailwind backs the buy-and-hold thesis.
Negotiation context
- Only 12 days on market — expect competitive offers; lowballing is unlikely to land.
- 3 sale attempts since 24y ago with the ask held roughly flat each time — persistent listings suggest the price (not the market) is what's stuck; bring a comps-based counter.
- Current owner paid $150k; 40% above their basis — modest negotiation headroom, anchor on the comps not their cost.
Questions for the listing agent
- What do current leases actually rent for vs. the listed asking? Can we see a recent rent roll and the last 12 months of T-12 income?
- Built in 1965 — when were the roof, HVAC, electrical panel, plumbing, and water heater last replaced?
- What does the HOA fee cover, when was the last increase, and are there any pending special assessments or reserve-fund shortfalls?
- Is there a deadline driving the sale (1031 exchange, divorce, estate, relocation)? That informs how much negotiation room exists.
- The area grade is low — what's the realistic commute time and amenity access for the typical tenant pool here? Any planned neighborhood developments (good or bad) we should know about?
- What's the average days-on-market for RENTAL listings here right now (not sales)? A rising rental-DOM trend means longer vacancies and softer asking-rent achievability than the comps imply.
- What's the recent tenant-quality profile in this submarket — average credit score on applications, eviction rate, late-payment / NSF rate, and stable-employment percentage? A property-management company in the area should have these aggregated.
- How much new for-sale + rental construction is in the pipeline within 1–3 miles? Heavy new supply typically softens prices + rents 12–24 months out; constrained supply supports both.
Investment metrics
- 1% rule
- 0.81% ✗
- Cap rate
- 6.12%
- Cash-on-cash
- -0.63%
- DSCR
- 0.97
- GRM
- 10.2
CMA / ARV
- ARV (on-the-fly)
- $196,800
- Comps found
- 11
Show comp detail 11 sales within ~0.75 mi
| Address | Dist | Beds/Ba | Sqft | Sold | Price | $/sf | Match |
|---|---|---|---|---|---|---|---|
| 3408 NE 67th St | 0.14mi | 3/1.5 | 1,244 (+4%) | 9mo | $170,000 | $137 | 78 |
| 3415 NE 69th St | 0.32mi | 3/2.5 | 1,232 (+3%) | 18mo | $179,900 | $146 | 64 |
| 3703 68th Ter | 0.23mi | 2/1.5 (-1) | 1,280 (+7%) | 14mo | $180,000 | $141 | 60 |
| 6751 N Askew Cir | 0.17mi | 2/1.5 (-1) | 1,056 (-12%) | 8mo | $175,000 | $166 | 59 |
| 3615 NE 68th Ter | 0.22mi | 2/1.5 (-1) | 1,024 (-15%) | 1mo | $165,000 | $161 | 58 |
| 3619 NE 68th Ter | 0.23mi | 2/1.5 (-1) | 1,024 (-15%) | 3mo | $185,000 | $181 | 55 |
| 7138 NE Kingston Ct | 0.60mi | 3/1.5 | 1,106 (-8%) | 5mo | $184,900 | $167 | 53 |
| 6811 N Askew Cir | 0.21mi | 2/1.5 (-1) | 1,300 (+8%) | 23mo | $175,000 | $135 | 50 |
| 7199 NE Kingston Ct | 0.64mi | 2/2.0 (-1) | 1,310 (+9%) | 11mo | $245,000 | $187 | 41 |
| 3727 NE 68th Ter | 0.21mi | 2/1.5 (-1) | 1,024 (-15%) | 22mo | $175,000 | $171 | 40 |
| 3609 NE 68th Ter | 0.23mi | 2/1.5 (-1) | 1,024 (-15%) | 22mo | $168,000 | $164 | 40 |
Match score weights: distance 35% · size 25% · config 20% · recency 20%. Top-matched comps best support the ARV.
Projected returns pro-forma
-3.0% appreciation · 6.09% rent growth · sell at horizon
- IRR
- -14.1%
- Equity multiple
- 0.48×
- Total profit
- $-30,540
- Equity at exit
- $31,312
- IRR
- -1.1%
- Equity multiple
- 0.91×
- Total profit
- $-5,230
- Equity at exit
- $18,157
Cash invested: $58,800 (down + closing). Projections, not guarantees.
Landlord ↔ Tenant lean methodology
- Overall (STATE)
- 81 Strongly Landlord-Friendly
- State Missouri
- 81 Strongly Landlord-Friendly · R+10
- County
- — inherits STATE
- City
- — inherits STATE
ZIP-level market 64119
- Rents YoY
- 6.1%
- Active inventory
- 183
- Price-to-rent
- 10.2×
Monthly cashflow live
- Estimated rent
- $1,711 high interval (Pro) →
- Mortgage (P&I)
- −$1,101
- Tax from tax record
- −$143 /mo · $1,715/yr
- Insurance
- −$88
- HOA
- −$51
- Vacancy / Maint / Mgmt
- −$359
- Net cashflow
- $-31
Break-even live
UW: 25.0% down · 7.5% · 30yr · 1.5% tax · 5.0% vac · 8.0% maint · 8.0% mgmt
Financing live
Cash to close
- Down payment
- $52,500
- Closing costs
- $6,300
- Reserves months
- —
- Total cash needed
- —
Loan-product check · same deal, 3 products live
Conventional
25% down · 7.5% · 30yr
- Down + closing
- —
- Monthly P&I
- —
- Monthly cashflow
- —
- DSCR
- —
- Eligible?
- —
Personal DTI + credit; lowest rate.
DSCR
20% down · 8.5% · 30yr
- Down + closing
- —
- Monthly P&I
- —
- Monthly cashflow
- —
- DSCR
- —
- Eligible?
- —
No personal income docs; deal must DSCR.
Hard money
10% down · 12.0% · 12mo
- Down + closing
- —
- Monthly P&I
- —
- Monthly cashflow
- —
- DSCR
- —
- Eligible?
- —
Short-term bridge; refi at stabilization.
Rent comps 6 comps
| Address | Beds | Baths | Sqft | Rent | $/sqft | DOM | Units | Dist |
|---|---|---|---|---|---|---|---|---|
| 3619 NE 68th Ter Kansas City, MO | 2.0 | 2.0 | 1024 | $1,600 | $1.56 | 43d | 1 | 0.20mi |
| 2483 NE 68th St Kansas City, MO | 2.0 | 2.0 | 928 | $1,325 | $1.43 | 4d | 1 | 0.81mi |
| 2404 NE 70th St Gladstone, MO | 1.0–2.0 | 1.0–2.0 | 857 | $1,075 | $1.25 | 43d | 1 | 0.85mi |
| 2813 A NE Kendallwood Pkwy Gladstone, MO | 1.0–3.0 | 1.0–2.5 | 1079 | $1,895 | $1.76 | 43d | 1 | 1.20mi |
| 2307 NE 59th St Kansas City, MO | 3.0 | 1.0 | 1150 | $1,710 | $1.49 | 21d | 1 | 1.30mi |
| 1403 NE 67th Pl Kansas City, MO | 3.0 | 1.0 | 1132 | $1,626 | $1.44 | 4d | 1 | 1.45mi |
HOA detail
- Monthly dues
- $51 · $612/yr
Listing history 9 events
-
2026-06-13statusdays on market $210,000 Pending 12 DOM
-
2026-06-09days on market $210,000 Active 11 DOM
-
2026-06-08days on market $210,000 Active 10 DOM
-
2026-06-07days on market $210,000 Active 9 DOM
-
2026-06-05days on market $210,000 Active 6 DOM
-
2026-06-03days on market $210,000 Active 5 DOM
-
2026-06-02days on market $210,000 Active 4 DOM
-
2026-06-01days on market $210,000 Active 3 DOM
-
2026-05-31days on market $210,000 Active 2 DOM
ⓘ Source: listings_history table (triggers on properties + properties_extension) + one-shot
backfill from property_details.listing_events for pre-trigger history.
Tax reassessment forecast MO · Resets to sale price
- Current annual tax
- $1,715 · $143/mo
- Projected year-2 tax
- $2,037 · $170/mo
- Expected delta
- +$322/yr (+$27/mo · 18.8%)
ⓘ Screening estimate from a state-policy table — verify with the county assessor before closing.
Climate risk First Street
- Flood 1/10 Low FEMA zone X (unshaded) · 0% chance over 30 yrs
- Wildfire 2/10 Low
- Heat 4/10 Moderate 7 d/yr ≥106°F today · 17 d/yr by 30 yrs out
- Wind 2/10 Low
- Air quality 3/10 Moderate 2 unhealthy d/yr today · 3 by 30 yrs out
Nearby sold comps map
Loading sold comps map…
Walkable amenities ~0.75 mi
Loading nearby amenities…
Taxation est. · year 1
- Rental income
- $20,531
- − Mortgage interest
- −$11,763
- − Property taxes
- −$1,715
- − Insurance
- −$1,050
- − Repairs & maintenance
- −$1,642
- − Management
- −$1,642
- − HOA
- −$612
- − Depreciation
- −$6,109
- Taxable loss
- −$4,003
- Est. tax savings @ 24.0%
- +$961
- After-tax cash flow
- $588/yr
For passive investors: Depreciation is non-cash, so a rental often shows a tax loss while cash-flowing — sheltering income. Rental losses are passive: they offset passive income freely, and up to $25,000/yr can offset ordinary (W-2) income if you actively participate and your MAGI is under $100k (phasing out to $0 by $150k); unused losses carry forward. On sale, claimed depreciation is recaptured at up to 25%, and gains may owe capital-gains tax (a 1031 exchange can defer both). Figures are a year-1 estimate at your 24.0% rate — not tax advice; consult a CPA.
Schools (NCES district)
- District
- North Kansas City 74
- NCES district ID
- 2922800
- Math proficiency
- 38% ▼ -11.00%
- Reading proficiency
- 49% ▼ -3.00%
- Median HH income
- $55,444
- Composite
- 37.88/100
- National rank
- #4321
- State rank
- #98 of 324 in MO
Livability — Gladstone
- Score
- 76/100
- State rank
- #44
- US rank
- #3612
Category grades
Schools grade is shown separately in the Schools card above.
Census & demographics
- Census place
- Gladstone, MO
- County
- Clay County · 220,651 people
- City population
- 41,984
- Metro
- Kansas City, MO-KS
- Population (ZIP)
- 33,199
- Household income
- $83,929
- Rent vs Own
- Severe rent burden
- 603.0
Population outlook (Clay County) Hauer SSP2
- Today (2025)
- 266,022 people
- By 2030
- 280,057 · +5.3%
- By 2040
- 306,153 · +15.1%
- By 2050
- 328,630 · +23.5%
- By 2075
- 375,182 · +41.0%
- By 2100
- 392,861 · +47.7%
Race, ethnicity, and origin ACS 2023
- Neighborhood character
- Predominantly White (75%)
- Race & ethnicity
- White 75% Hispanic / Latino 8% Two or more races 8% Black 7% Asian 3% Pacific Islander 1%
- Hispanic origin (detail)
- Mexican 6%
- Common ancestry
- Romanian 2% Italian 2% Slovak 2%
- Foreign-born
- 7% · Canada, Vietnam, Jamaica
- Languages at home
- 90% English-only · Spanish 5% Other Asian/Pacific 1% Other Indo-European 1%
Political lean MEDSL · Clay
- 2024 margin
- Lean R (+5.6) · D 46.4% · R 52.0% · Other 1.6%
- 2008→2024 swing
- -4.9pp toward R · 2008: -0.7pp · 2024: -5.6pp
- All cycles
- 2024: R+5.6 2020: R+4.1 2016: R+11.1 2012: R+8.4 2008: R+0.7
Not yet ingested
- Civics
- —
Market trends
- HPI YoY
- ▼ -253.39%
- Current HPI
- 215.8366
- Rent YoY
- ▲ 6.09%
- Metro
- Kansas City, MO-KS
- State GDP YoY
- ▲ 1.84%
- F500 in state
- 20
Industry mix (Fortune 500 HQ in MO)
| Industry | F500 HQs | Revenue |
|---|---|---|
| Healthcare | 1 | $163B |
|
||
| Insurance | 1 | $21B |
|
||
| Industrial Technology | 1 | $17B |
|
||
| Retail | 1 | $16B |
|
||
| Industrial Distribution | 1 | $10B |
|
||
| Utilities | 1 | $9B |
|
||
Price history
+110.0% since first listed8 events — show timeline
- 2026-05-29 Listed $210,000 Heartland MLS as Distributed by MLS Grid
- 2024-01-05 Sold (Public Records) $150,000 Public Records
- 2017-07-06 Sold (Public Records) — Public Records
- 2010-12-06 Sold (Public Records) — Public Records
- 2010-12-03 Sold (MLS) — Heartland MLS as Distributed by MLS Grid
- 2010-06-10 Listed $74,500 Heartland MLS as Distributed by MLS Grid
- 2002-04-29 Sold (MLS) — Heartland MLS as Distributed by MLS Grid
- 2002-02-21 Listed $99,999 Heartland MLS as Distributed by MLS Grid
Property tax history
+3.3%/yrLatest (2025): $1,715 · +30.7% YoY. Source: county tax records.
Cash-flow waterfall
monthlySold comps — $/sqft
last 12 mo · ≤1 miLoading sold comps…