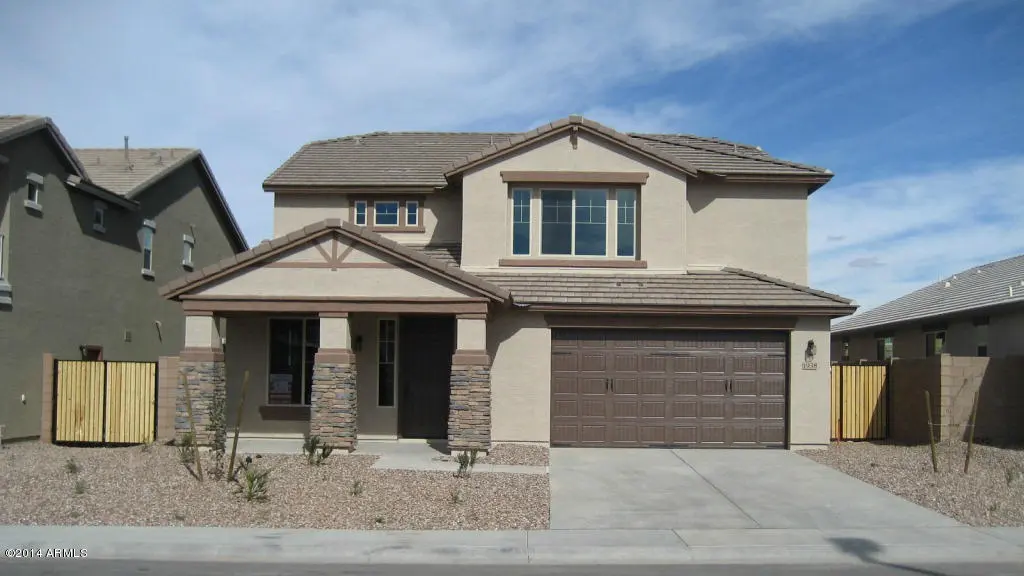
1938 E Hazeltine Way
Gilbert, AZ 85298
$674,800D
6 bd · 4.0 ba ·
3,099 sqft ·
Built 2014
· SingleFamily
· Active
· 26 DOM
Cashflow @ list (25.0% down · 7.5%)
Estimated rent
$3,782/mo
Mortgage (P&I)
−$3,539
Tax + insurance
−$511
HOA
−$116
Vac / Maint / Mgmt
−$794
Net cashflow
$-1,178/mo
Annual
$-14,135/yr
Cap rate
4.20%
Cash-on-cash
-7.48%
DSCR
0.67
1% rule
0.56%
Cash to close
$188,944
Investor read
- This is a 6-bed/4.0-bath single-family listed at $675k.
- At list price, monthly cash flow is $-1k ($-14k/yr) — negative.
- To cash-flow at today's rent, offer at most $467k (30.8% below list).
- To meet the 1% rule (rent ≥ 1% of price), the offer needs to be $378k (44.0% below list).
- It's been on market 26 days — a 2% lower offer ($665k) is reasonable based on typical stale-listing flexibility.
- Recommended offer: $378k (44.0% below list) — sets the bar for 1% rule.
- In year one you build about $61k of equity ($5k loan paydown + $56k appreciation (8.4% local appreciation)).
- Location reads 87/100 on livability (#1 in AZ, #240 nationally) — a professional / high-income tenant draw. Strengths: schools A+, amenities A+, employment A+; Watch: health & safety C-, cost of living F.
- Chandler Unified District #80 (4242) (suburban): math 49% / reading 57% proficiency, ranked #31 of 249 in AZ (top 12%) — acceptable for families but not a draw, mixed tenant base, ~2y average lease.
- Market conditions: Rents rising fast (+4.3%/yr); 329 active listings in the ZIP; 3 comparable units currently listed for rent nearby; rentals at typical pace (median 15d on market — plan ~3-4 weeks tenant-placement turnaround); high-income renter base; 36,011 units permitted in Maricopa County in 2024 (12,801 in 5+ unit buildings).
- Maricopa County population projected at +38% by 2050 — long-run rental-demand tailwind backs the buy-and-hold thesis.
- 2 sale attempts since 12y ago with the ask held roughly flat each time — persistent listings suggest the price (not the market) is what's stuck; bring a comps-based counter.
- Current owner paid $331k; list at $675k implies a 104% gain — meaningful room to come down on a strong offer.
- By year 2, paydown + projected appreciation supports a ~$98k cash-out refi (75% LTV) — recoverable capital for the next deal without selling this one.
- Climate carrying-cost: major wildfire risk; extreme-heat days projected 7→20/yr by 2055 (HVAC capex compounding) — expect insurance premiums to compound above CPI over the hold.
- Cap rate 4.2% vs local median 3.2% in Gilbert — top-decile yield for the area; either an underpriced asset or a hidden risk that comps aren't pricing in. Stress-test before assuming the spread holds.
Questions for listing agent
- What do current leases actually rent for vs. the listed asking? Can we see a recent rent roll and the last 12 months of T-12 income?
- What does the HOA fee cover, when was the last increase, and are there any pending special assessments or reserve-fund shortfalls?
- Is there a deadline driving the sale (1031 exchange, divorce, estate, relocation)? That informs how much negotiation room exists.
- Schools are A-rated — typically a magnet for longer-tenancy family renters. What's the average tenant stay here, and is there a school-zone premium baked into asking?
- The area grade is low — what's the realistic commute time and amenity access for the typical tenant pool here? Any planned neighborhood developments (good or bad) we should know about?
- What's the average days-on-market for RENTAL listings here right now (not sales)? A rising rental-DOM trend means longer vacancies and softer asking-rent achievability than the comps imply.
- What's the recent tenant-quality profile in this submarket — average credit score on applications, eviction rate, late-payment / NSF rate, and stable-employment percentage? A property-management company in the area should have these aggregated.
- How much new for-sale + rental construction is in the pipeline within 1–3 miles? Heavy new supply typically softens prices + rents 12–24 months out; constrained supply supports both.
CashFlowRE · CFR-2SCS0R99YSEHMY
· Data 2 days ago
cashflowre.app · 2026-05-29